100+ Infographics To Understand and Manage Your E-Waste Better
Photo Credit: freepik.com
E-waste or electronic waste is one of the most pressing environmental concerns in the world. Not only e-waste generation is fast, but it increases every year too. To keep pace with rapid software development, we continue to upgrade our hardware, disposing of old electronics and buying new ones.
On the one hand, this supports technological advancements, but on the other, the cost to the planet and its people is grave and absolute.
Poor handling of e-waste (and continually adding more to it) breeds issues as vast as climate change, soil and water pollution, human rights abuses, health hazards, cybersecurity threats, internal displacements, child labor, conflict mining, and so much more.
To pull this bull by the horns and minimize commercial and residential e-waste, education remains the key. Below we have collected 100+ infographics to help you with that. Use these incredible data presentations to educate yourselves, your schools, workspaces, and businesses to embed electronic recycling more closely into your daily life.
100+ Infographics that Demistify Electronic Recycling
The infographics below address a range of topics within the electronic recycling realm. From the basics of e-waste recycling to sustainable living goals, you’ll find everything here.
1. What is e-waste?

Image Source: servermonkey.com
This infographic gives you a succinct definition of e-waste, outlining what it is, the hazardous materials found in it, and the proper way to dispose of common electronics.
2. E-waste at a glance

Image Source: greenerideal.com
Before we get into the details, take an overall look at what’s e-waste and how to fix it.
3. Understanding e-waste
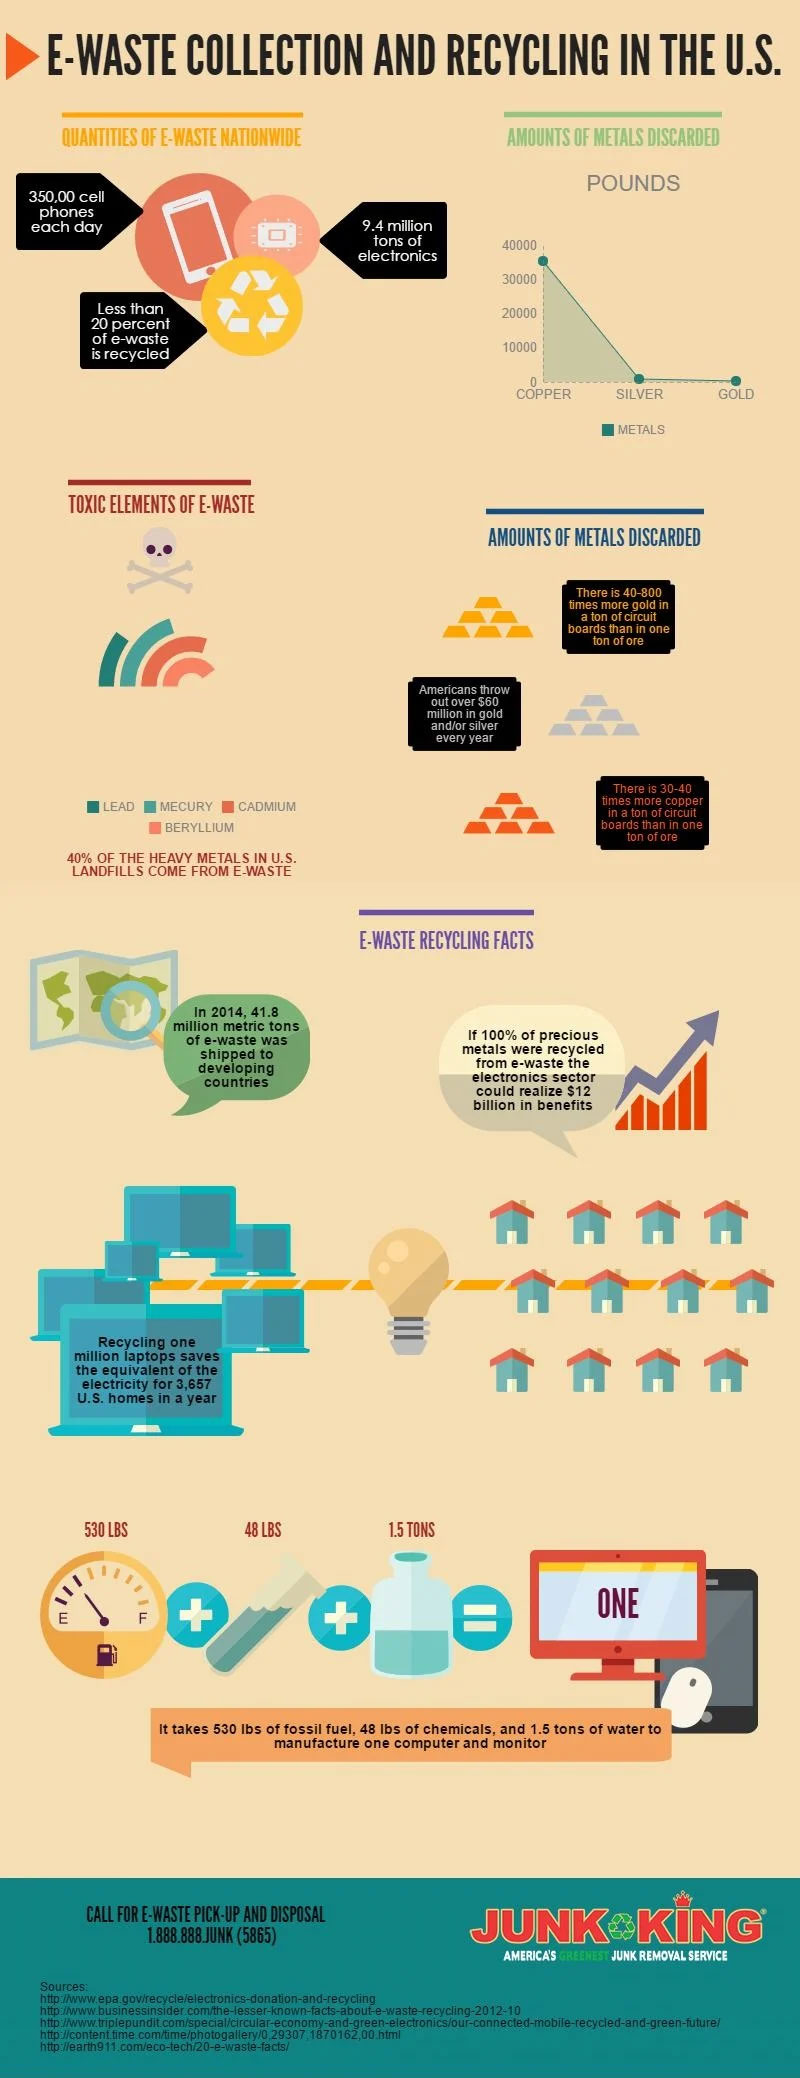
Image Source: info.junk-king.com
An incredible amount of resources go into creating a single laptop or cellphone. Learn what we do with the devices after all the hard work it takes to make them.
4. A look into the past

Image Source: pureplanetrecycling.co.uk
Below are some numbers from 2014 to show you how quickly the e-waste issue has gathered speed and momentum.
5.What causes electronic waste

Image Source: techopedia.com
As the e-waste issue continues to worsen, let’s take a look at the factors causing the crisis.
6. The reality of e-waste
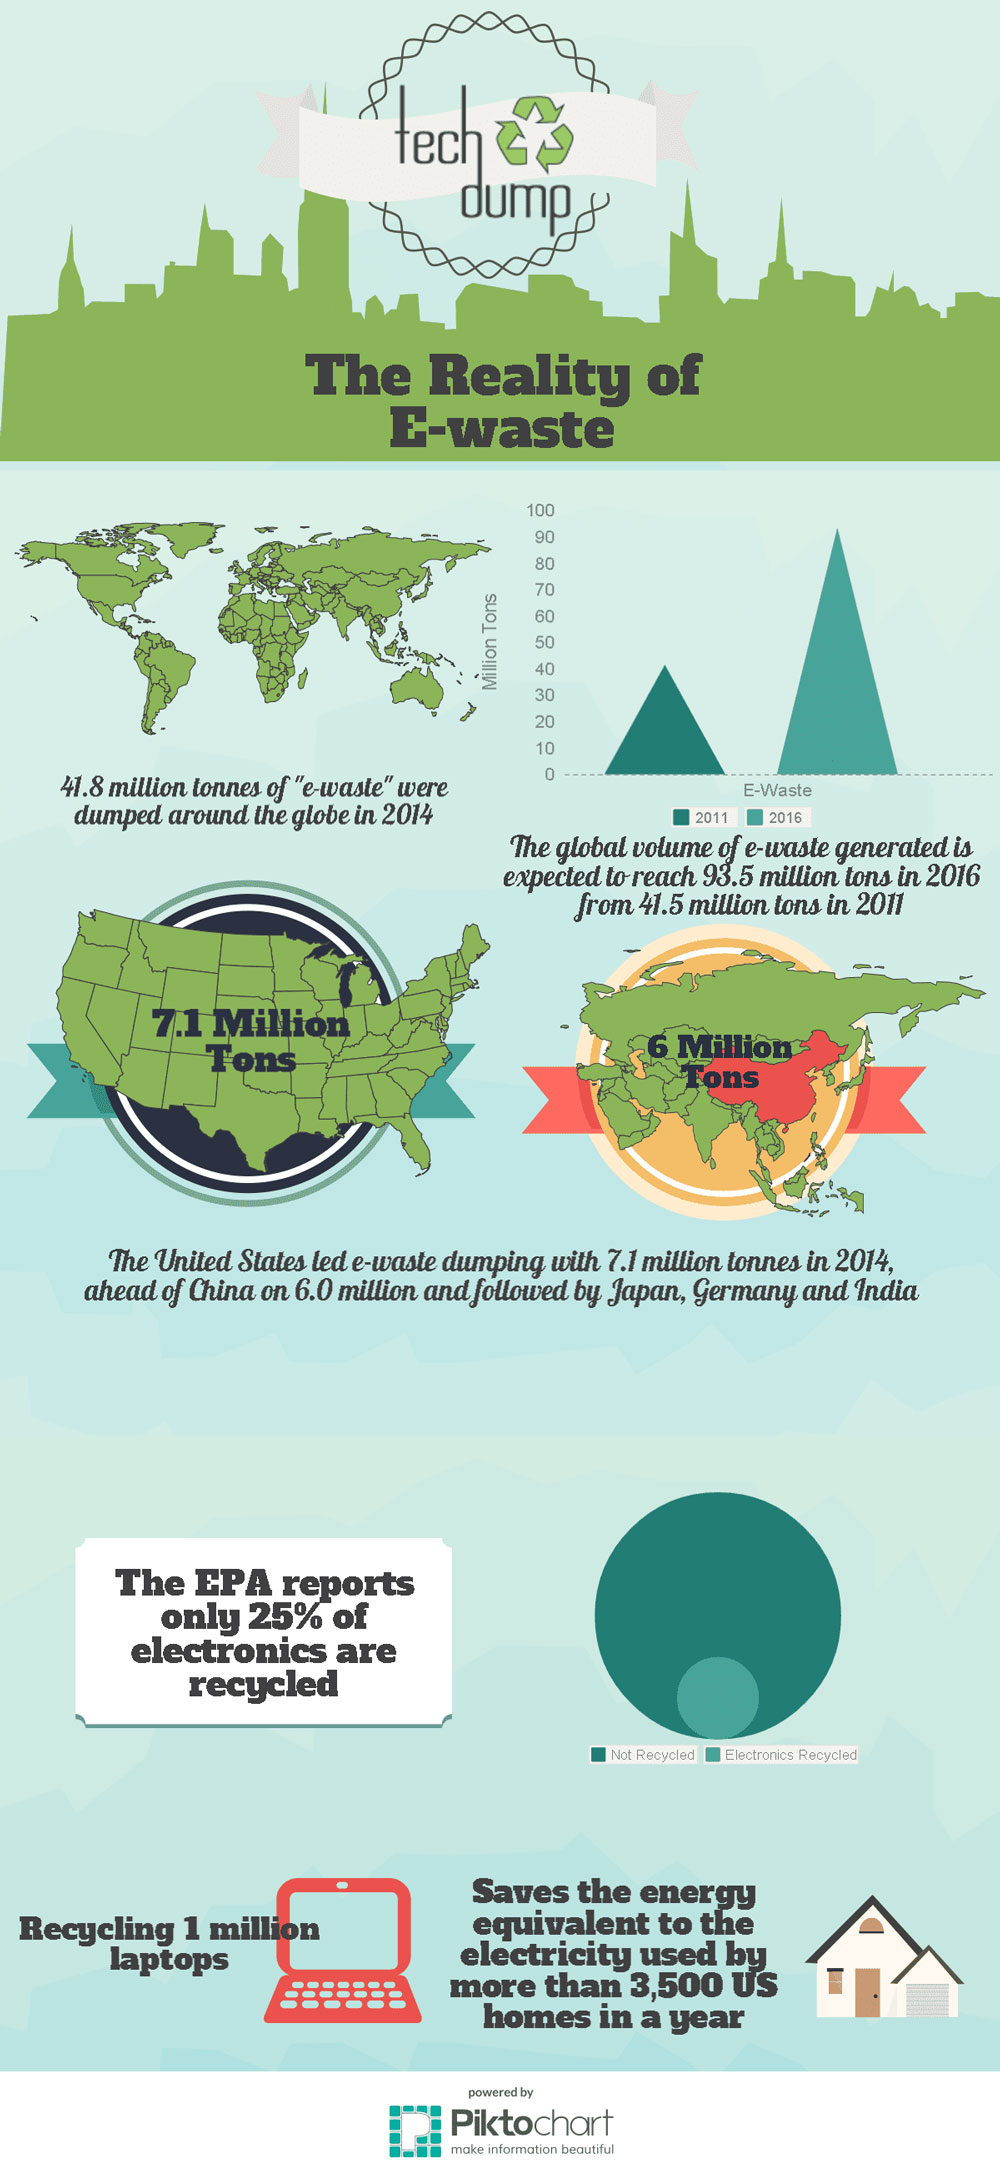
Image Source: getrepowered.org
The world dumps most of its old electronics as discarded waste every year. Even though those electronics contain a wealth of valuable materials in them. For example, if only one million laptops were recycled, they’d be able to power more than 3.500 American homes
7. The impact of e-waste

Image Source: hp.com
To reduce the impact of e-waste, it’s fundamental first to understand how big it is. HP published this infographic a few years ago to talk about the impact of e-waste. Interestingly, the company failed to mention its share of the problem and what it is doing to combat that.
8. Distribution of types of e-waste
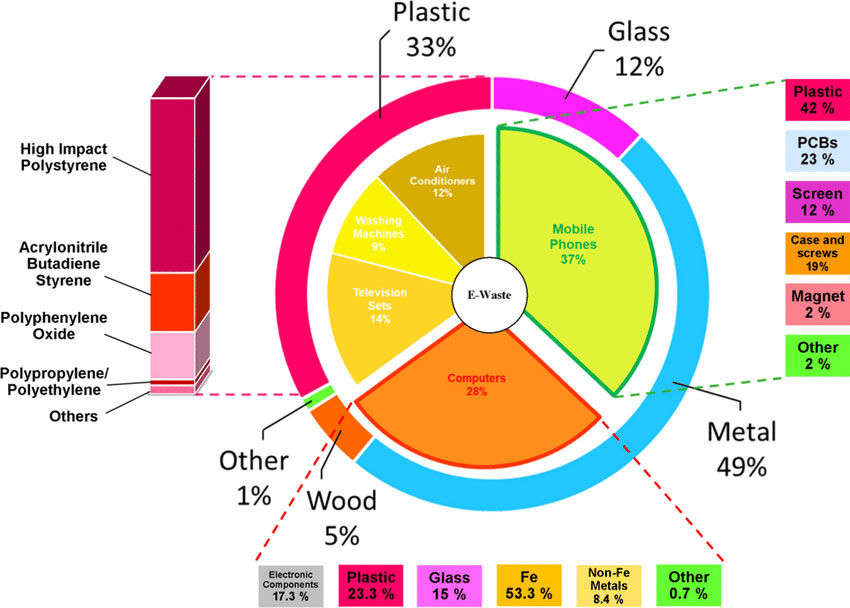
Image Source: researchgate.net
This infographic shows the distribution of types of e-waste collected from homes and workplaces.
9. Why is e-waste growing so fast?
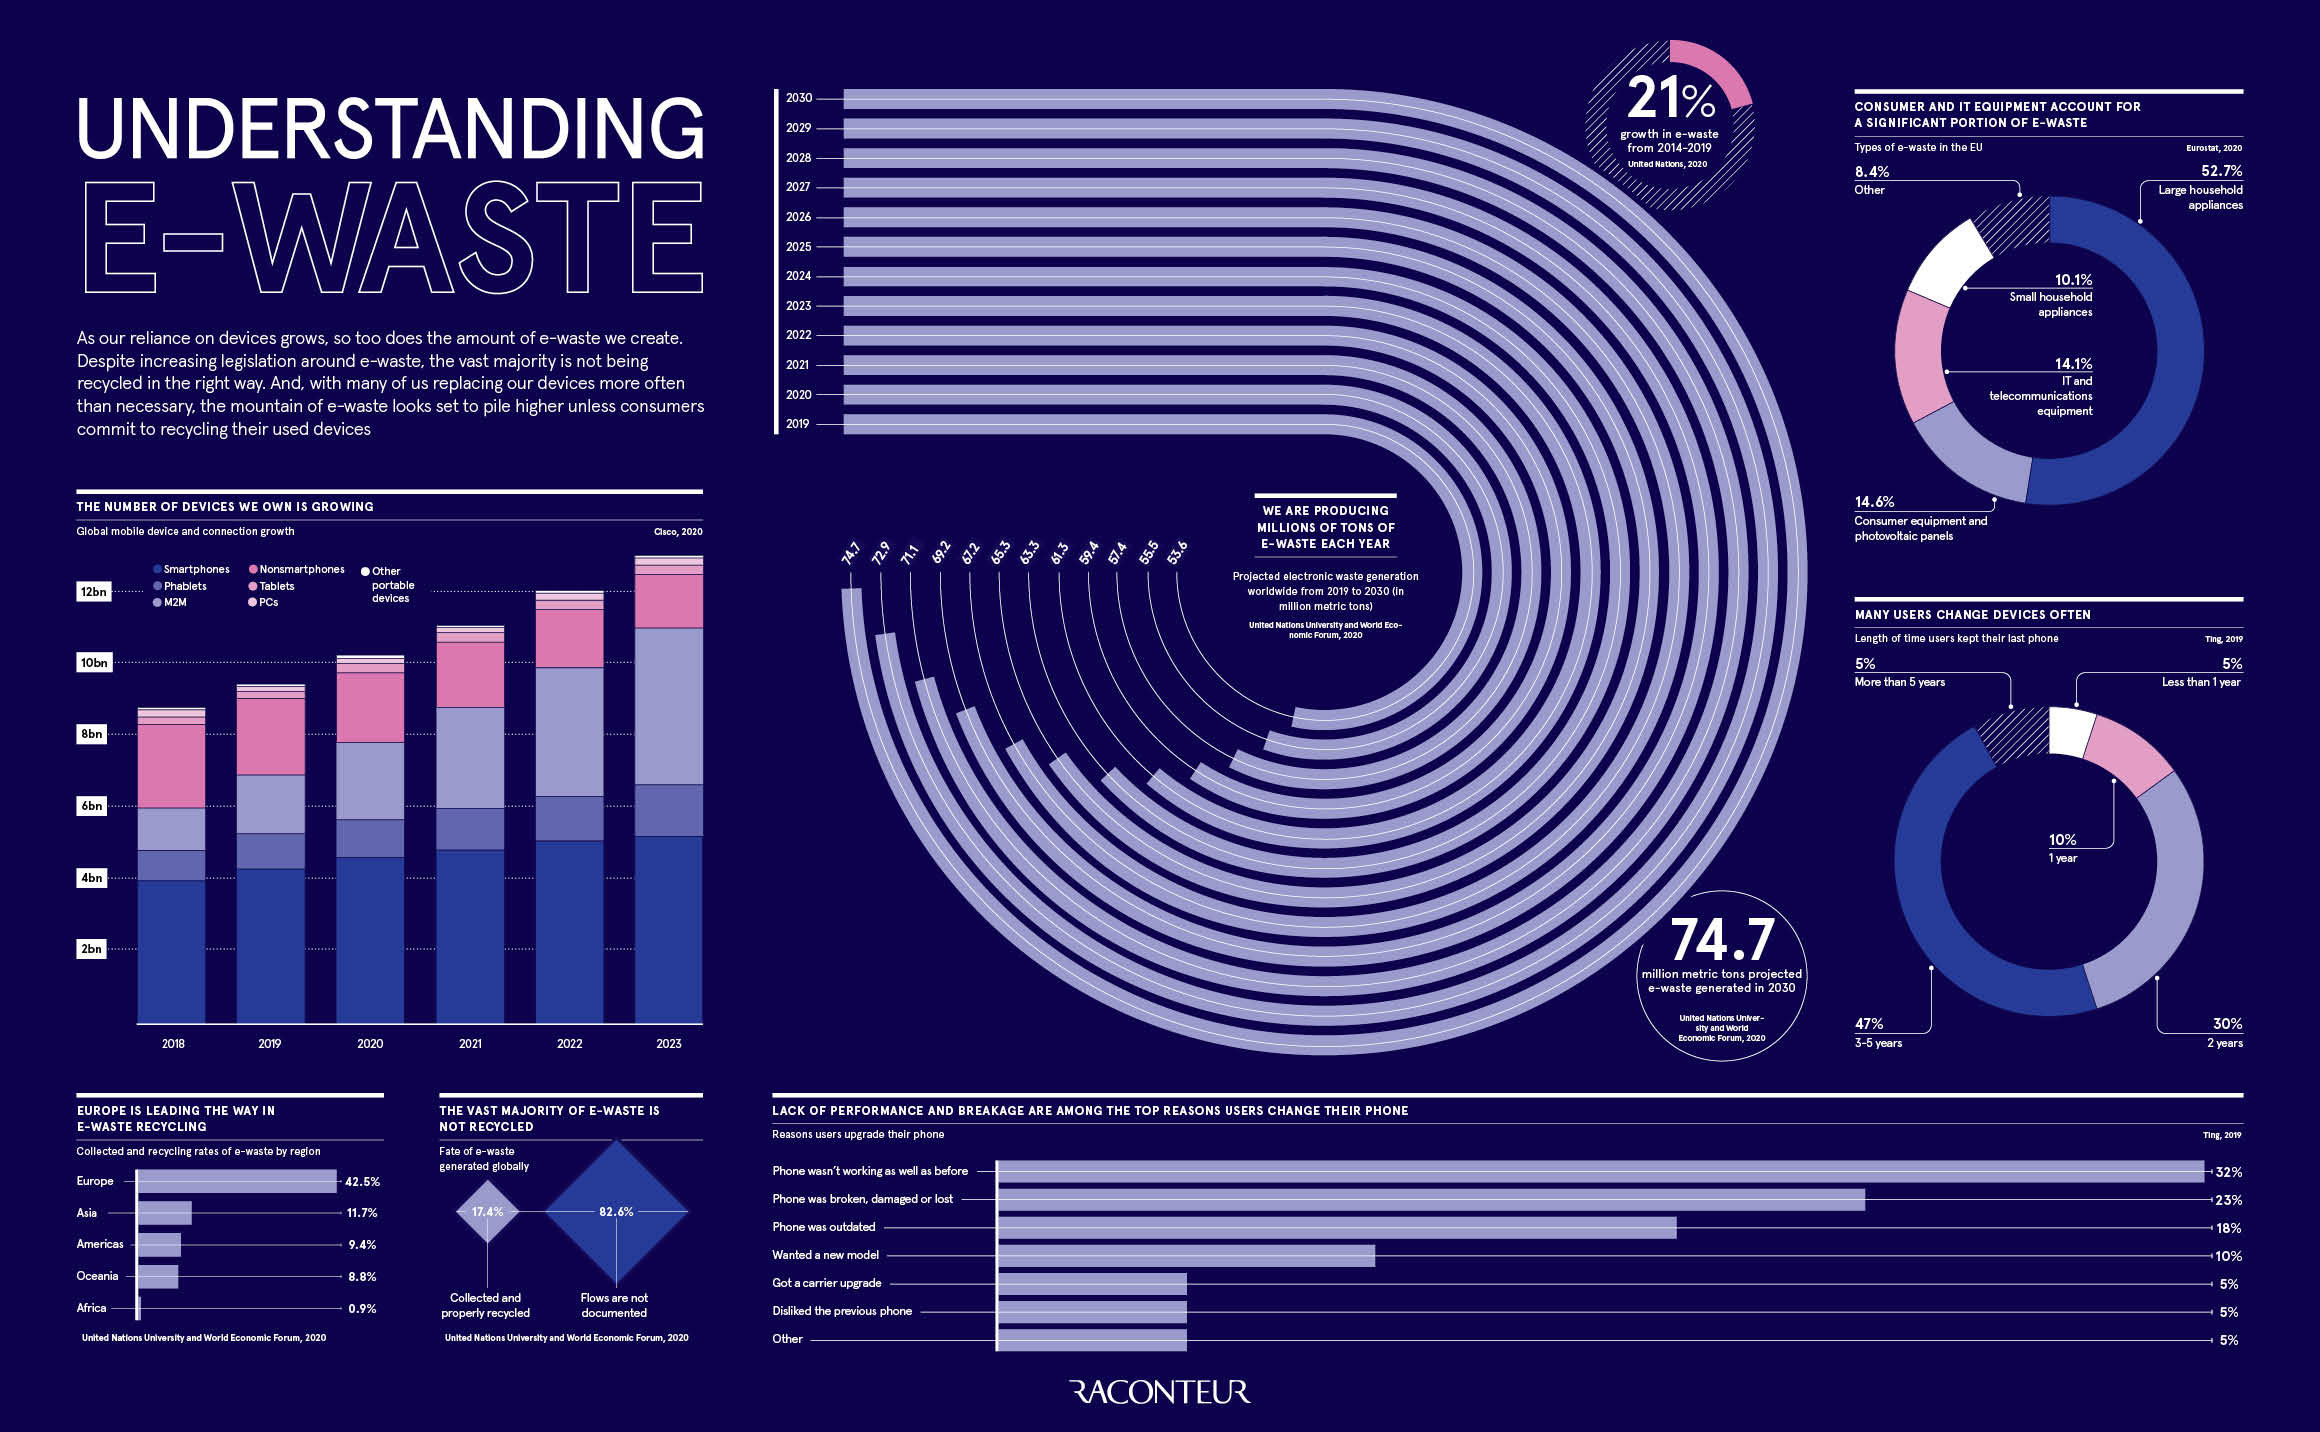
Image Source: raconteur.net
An infographic by Raconteur outlines factors responsible for the rapid rise in e-waste around the world.
10. How long does waste last

Image Source: globaltrashsolutions.com
Some types of waste are easy to recycle, some decompose naturally without putting more strain on the resources, and some types of trash never go away. Find out more below.
11. E-waste by the numbers

Image Source: adepem.com
This infographic puts into perspective the culture of obsolescence that we often talk about on this blog. With one-fourth of appliances failing within the first few years of their life, how realistic is it to put your hopes on e-waste recycling as the solution? Manufacturers of these devices must be held accountable and forced to make better products.
12. Some facts about e-waste
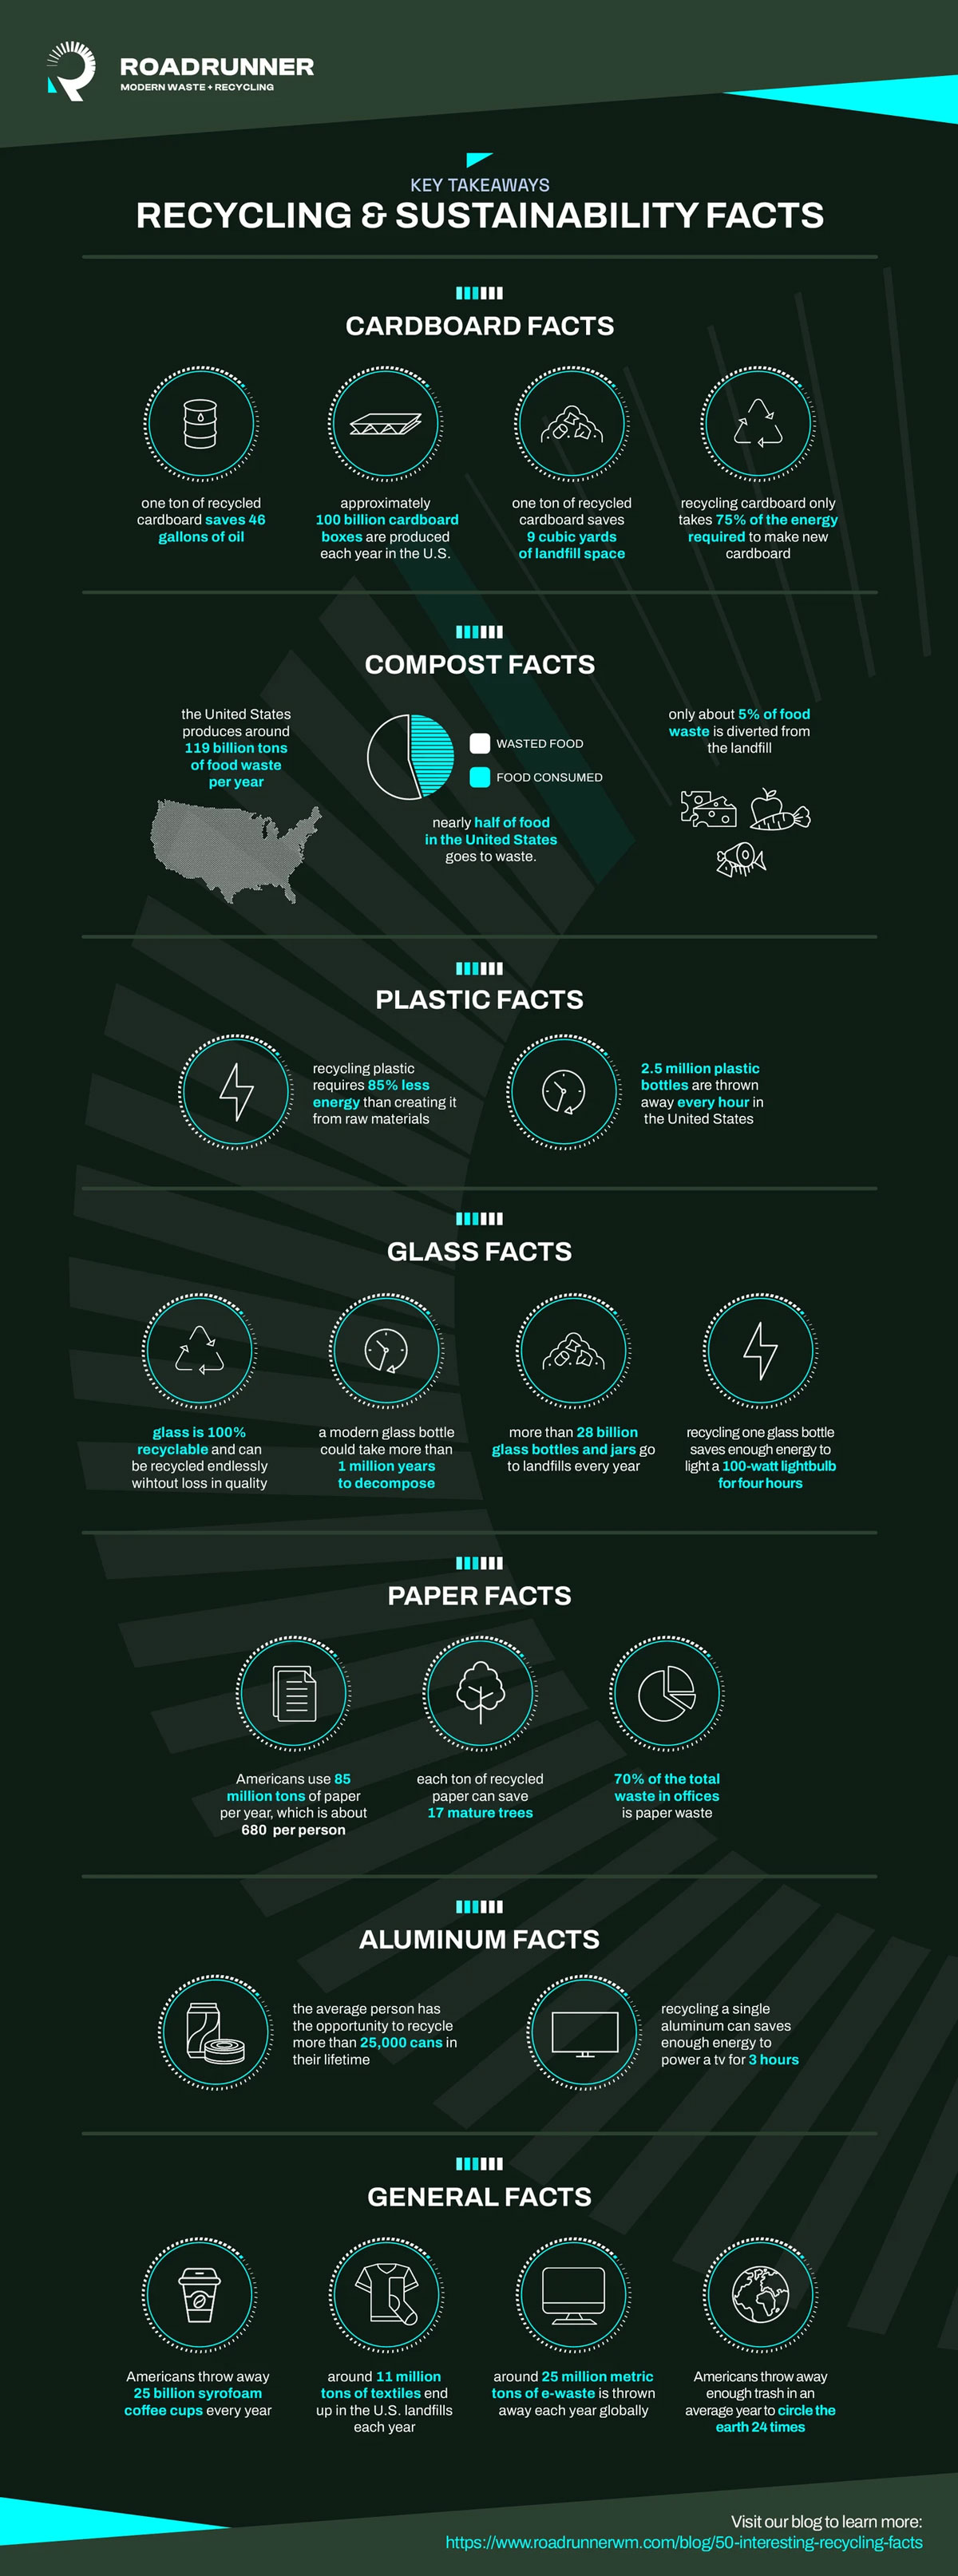
Image Source: roadrunnerwm.com
As mammoth-like as this problem has become, it can often feel too complicated to deal with. So here are 50 facts for you to understand e-waste and make sense of the issue.
13. Some more e-waste numbers
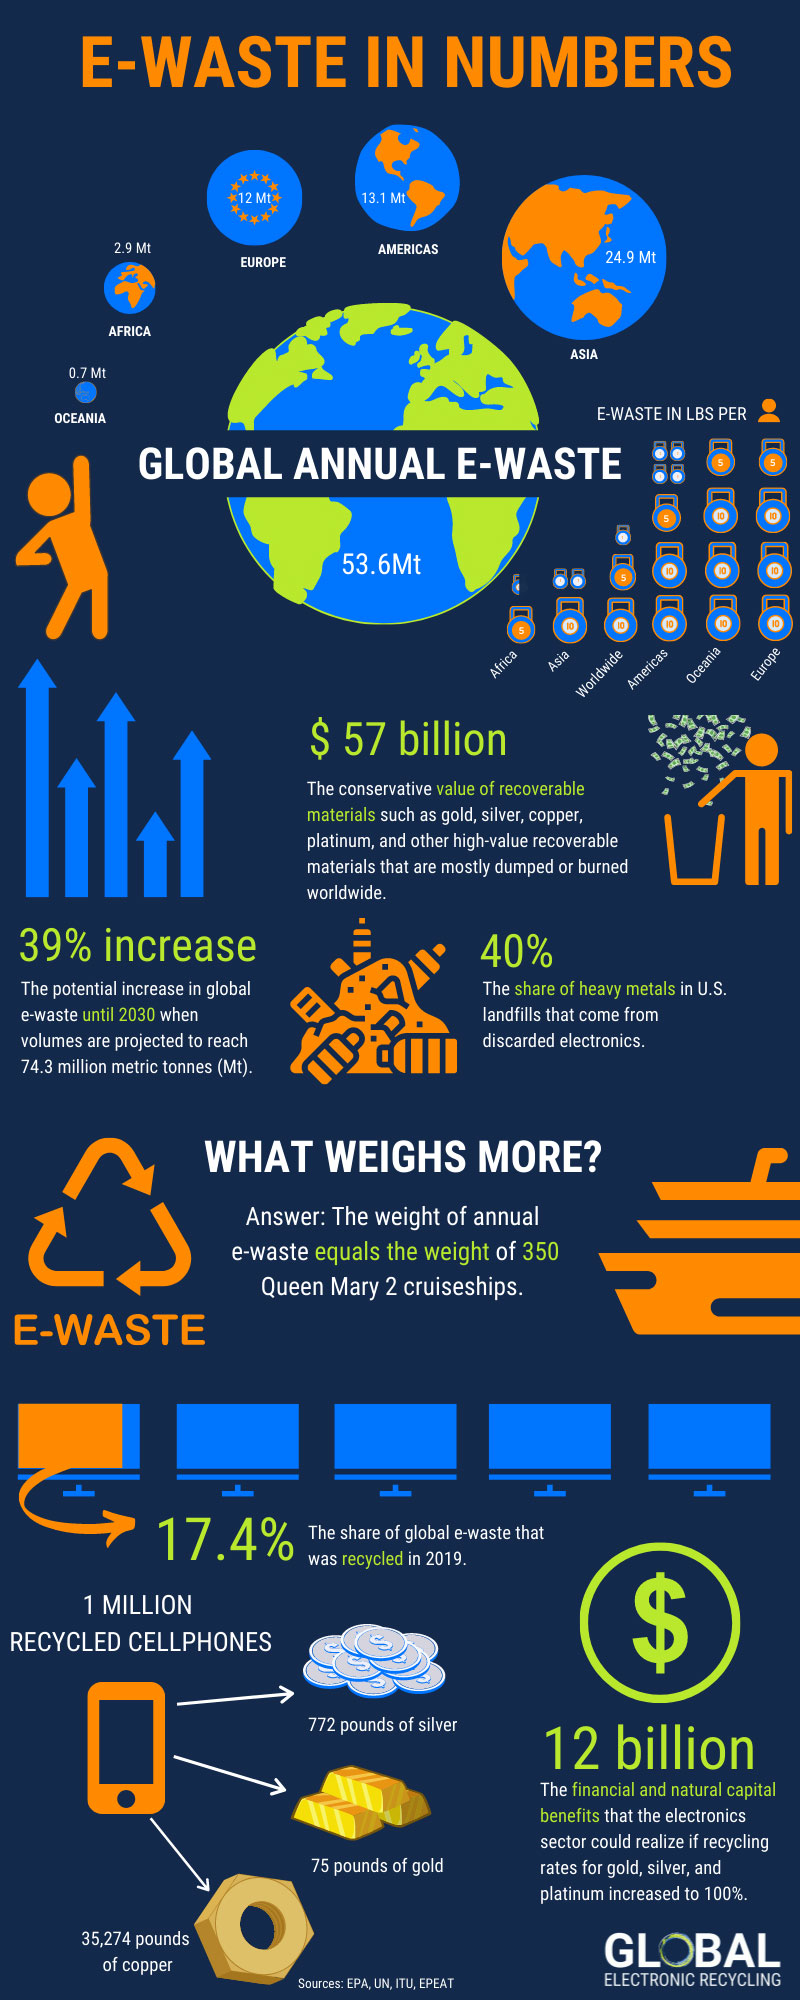
Image Source: gerteam.com
If the previous infographic wasn’t clear, here are some more numbers for your perusal.
14. The world’s worst e-waste offenders — per capita
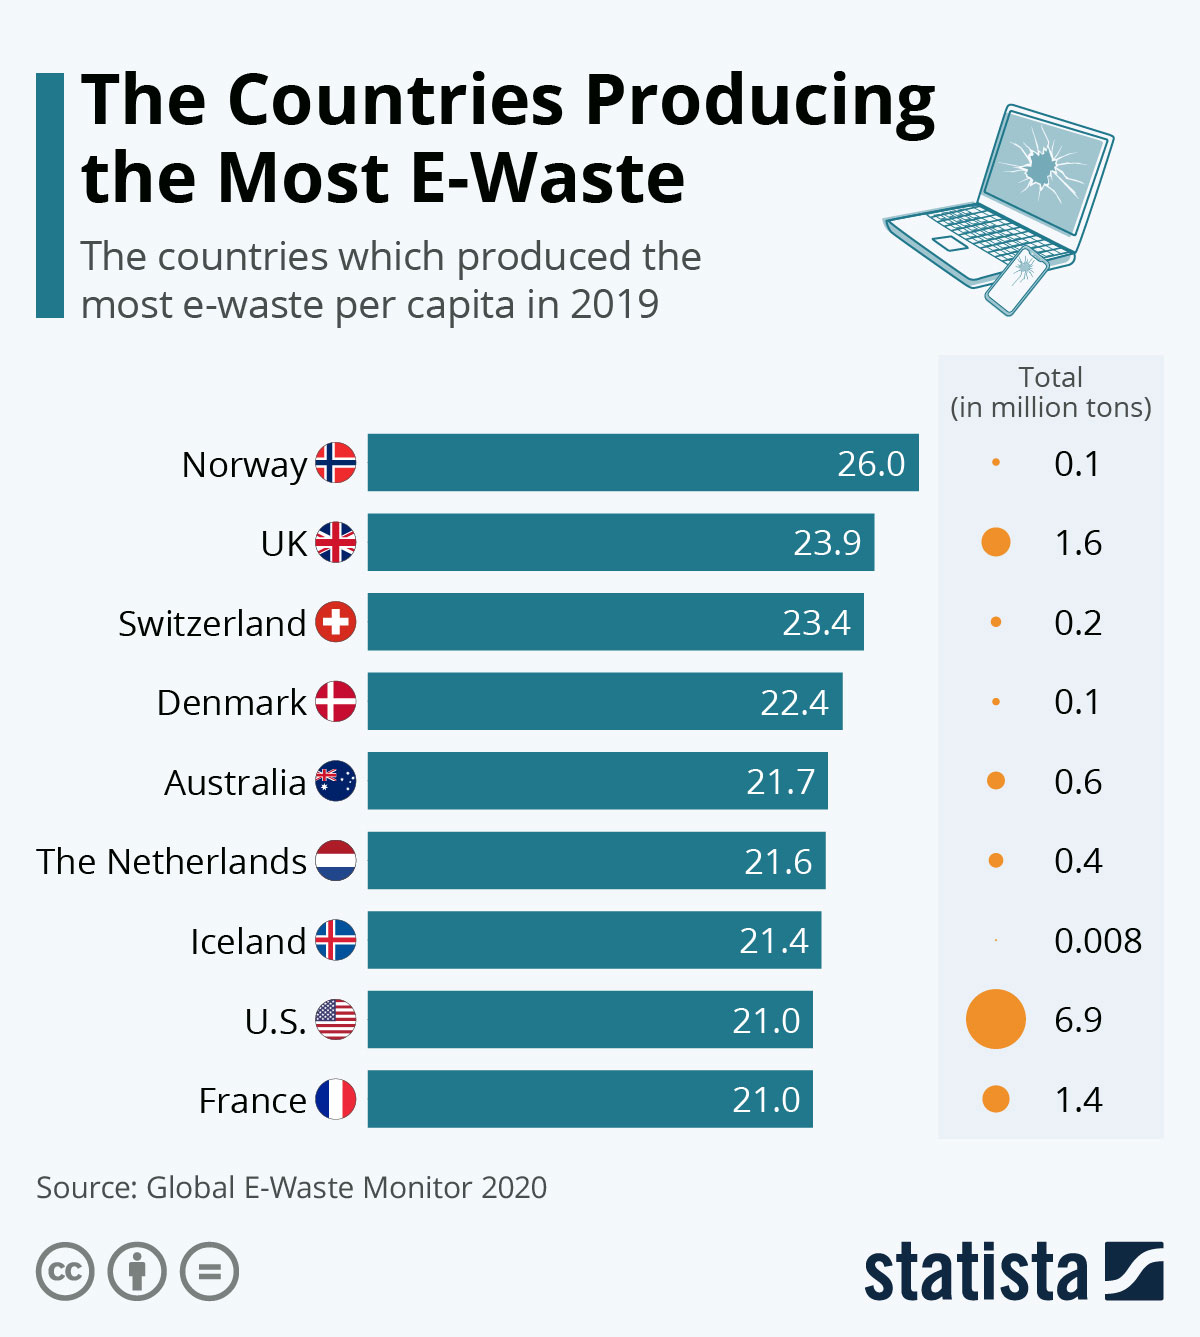
Image Source: statista.com
Did you think the U.S. is the world’s biggest producer of toxic e-waste? You’re wrong. That’s China. But in terms of per capita e-waste generation, the country that leads the charge is Norway, with 26 kilograms of e-waste per capita a year.
15. E-waste in the USA

Image Source: hummingbirdinternational.net
There are no country-wide laws instructing a standardized e-waste recycling process in the U.S. So far 25 states and the District of Colombia have passed e-waste laws, but half of the country remains without them.
16. E-waste in the UK

Image Source: okdo.com
In the first six months of 2021, the UK generated 148,134.09 tonnes of e-waste.
Quoting straight from the infographic, “You could build almost 15 Eiffel Towers with the amount of e-waste produced in the UK between January and June 2021.”
17. E-waste in Australia

Image Source: totalgreenrecycling.com.au
This brief set of numbers gives you a little peek into the e-waste problem in Australia. Though the digital divide is massive there, the amount of electronic devices thrown away every day is staggering.
18. E-waste in the European Union
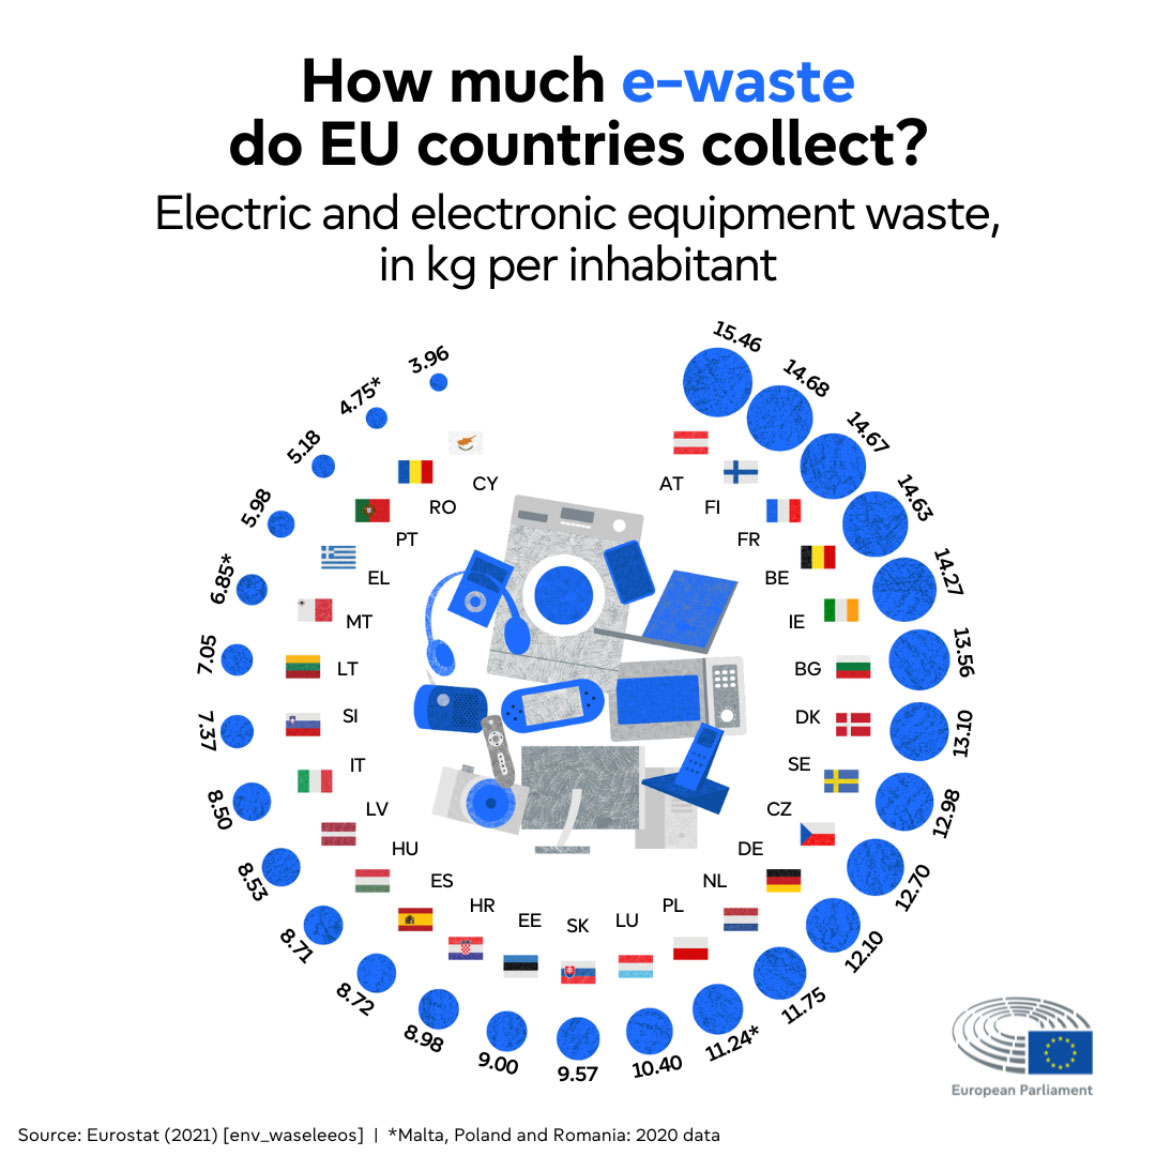
Image Source: europarl.europa.eu
In 2021, countries in the EU collected 13.5 million tonnes of e-waste they generated. Remember that the ‘collected e-waste’ is not the same as the ‘e-waste generated’. The e-waste produced by EU countries is much higher. The UK alone generates the second-highest amount of e-waste per capita in the world, with 23.9 kg.
19. E-waste in Singapore
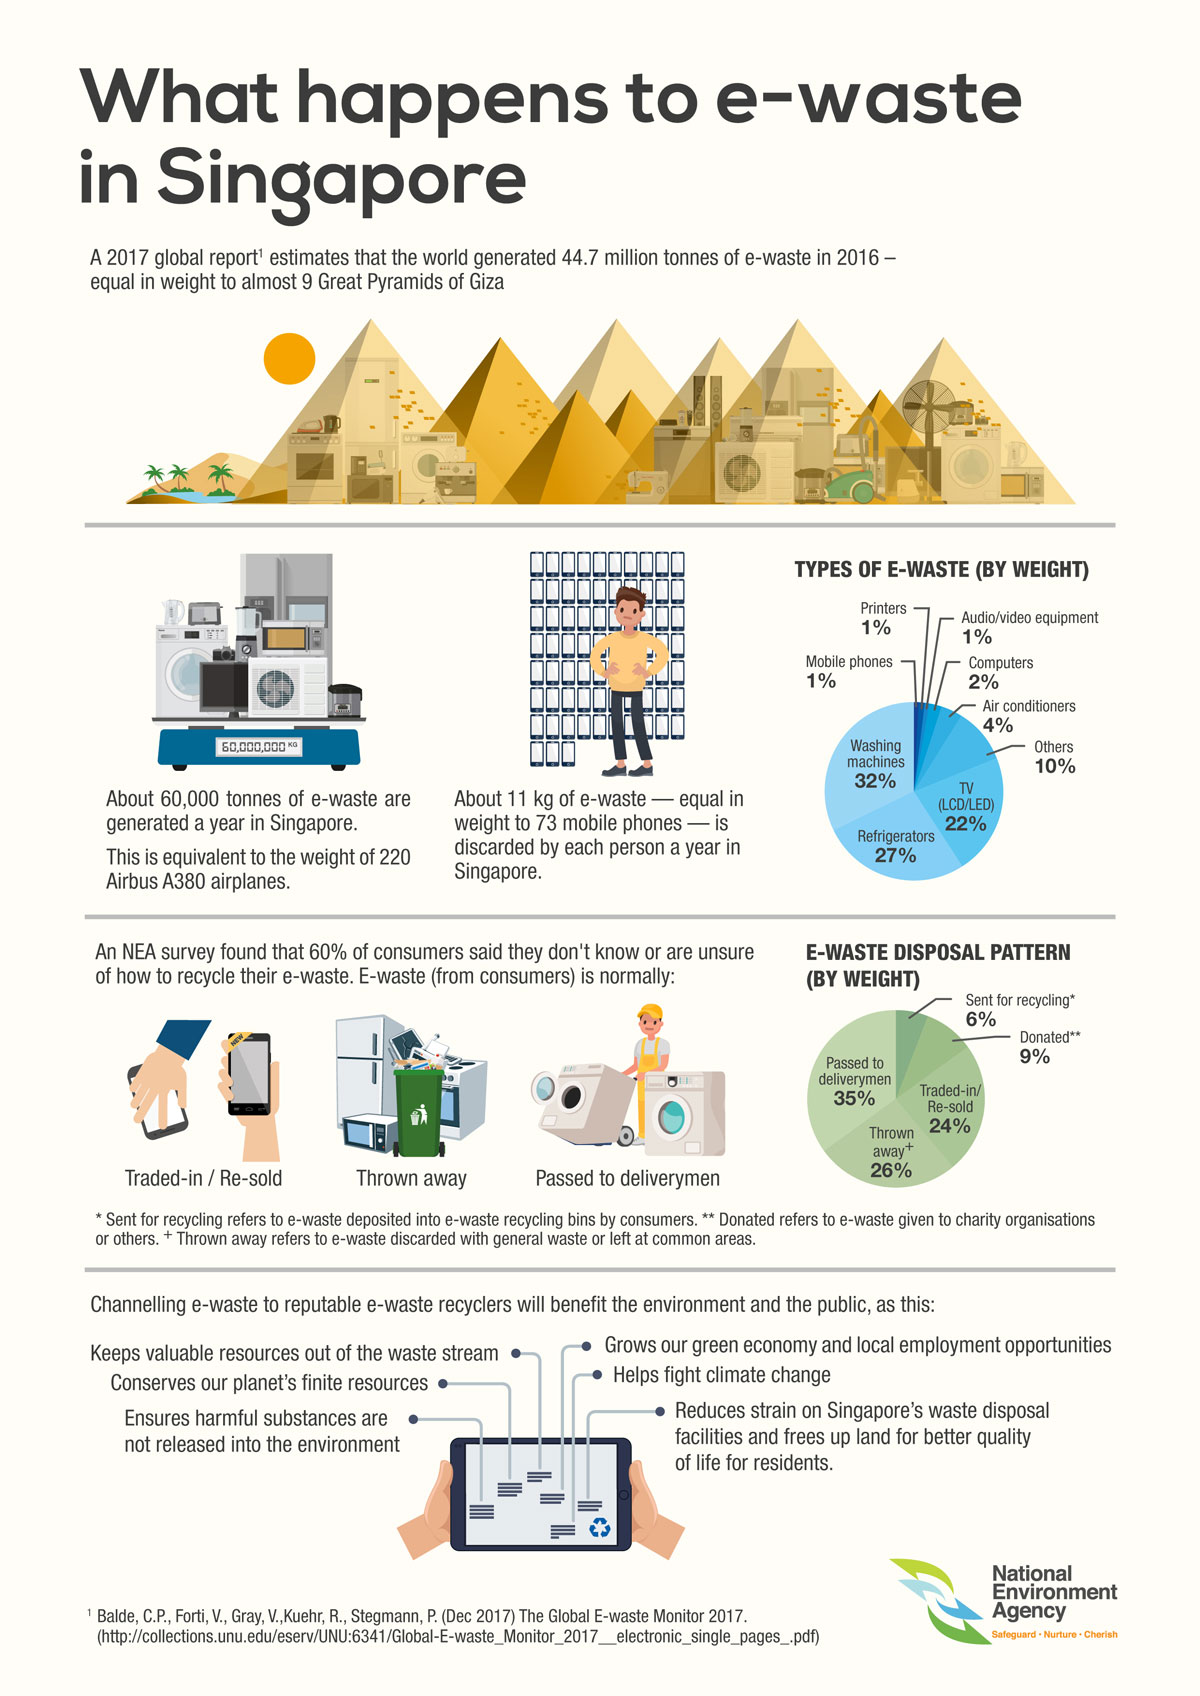
Image Source: nea.gov.sg
On average, Singapore generates about 60,000 tonnes of e-waste a year. This infographic is part of a detailed article that covers the e-waste issue in Singapore and government initiatives that are addressing the problem.
20. Global e-waste trajectory

Image Source: custommade.com
While this infographic contains many important data sets, look at their global e-waste trajectory section. You’ll see where the world’s toxic e-waste is being generated and where it’s being set — through legal and illegal means.
21. The digital dump
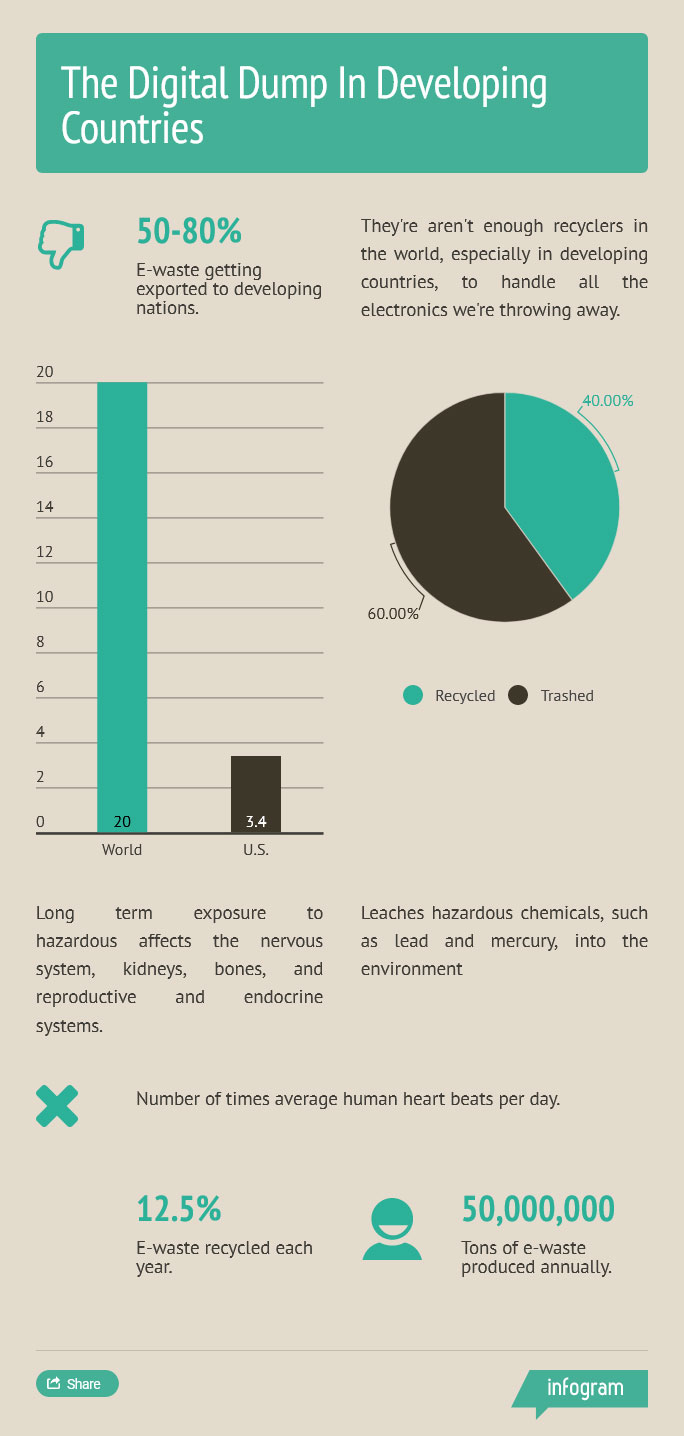
Image Source: infogram.com
The digital dump refers to the practice of exporting e-waste generated by the developed world to be taken care of by the underdeveloped world.
22. Tracking the world’s e-waste
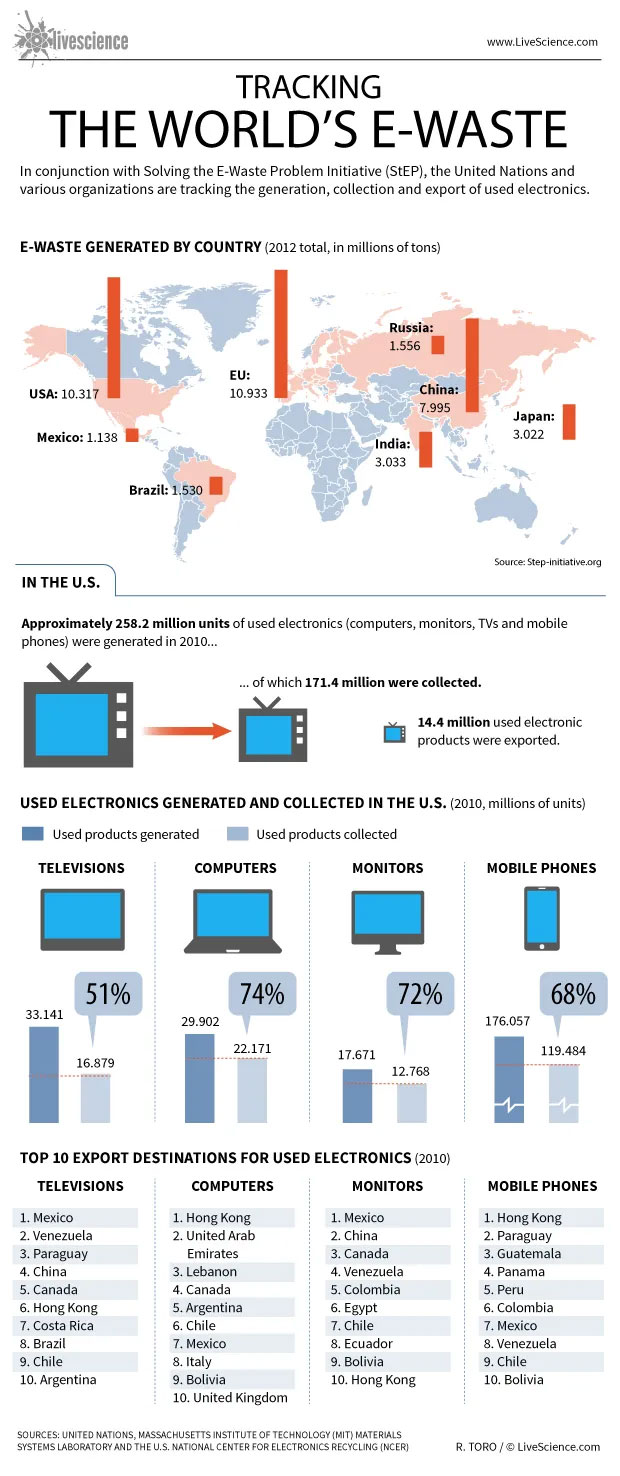
Image Source: livescience.com
Take a look at who generates the world’s e-waste and who is forced to clean up the mess they don’t create.
23. The human cost of e-waste

Image Source: inhabitat.com
The rich Western countries use the most amount of electronics and create the most amount of e-waste. Then they export this garbage to underdeveloped countries around the world. The lack of proper e-waste recycling legislation and infrastructure in those countries means people who work on those e-waste landfills are poor families and children. They routinely get exposed to dangerous toxins, leaks, and raw materials. Their soil gets polluted, water resources become poisonous, and air gets polluted.
That is the most toxic and dangerous side of the e-waste crisis.
24. The ‘waste’ in e-waste
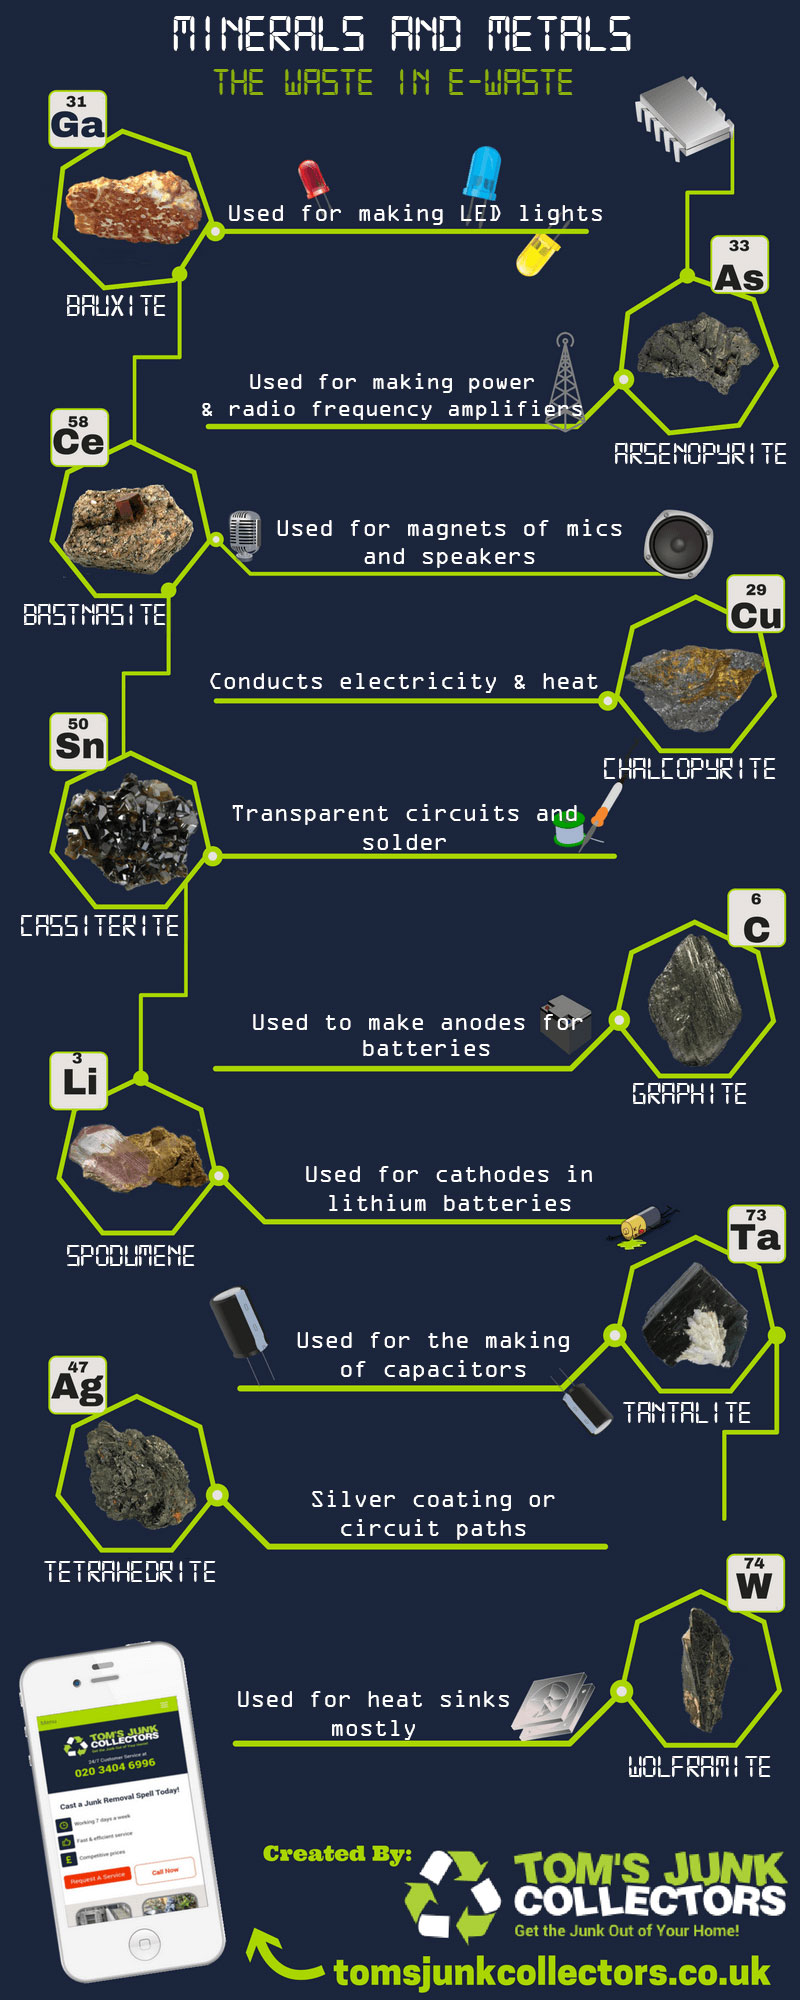
Image Source: infographicplaza.com
Even though we discard most of the electronic waste as pure waste, all our devices contain incredible amounts of precious metals and minerals. If we had recycled all our electronics, we would have recovered precious raw materials worth around $57 billion.
25. Global e-waste management market

Image Source: fortunebusinessinsights.com
The global e-waste management market is growing in response to rising e-waste and electronic recycling awareness. Take a look at what this industry entails.
26. The process of managing end-of-life IT equipment

Image Source: simslifecycle.com
Learn about the stages of e-waste recycling an electronic device goes through when it reaches its end of life.
27. The Sustainable Recycling Industries Organization
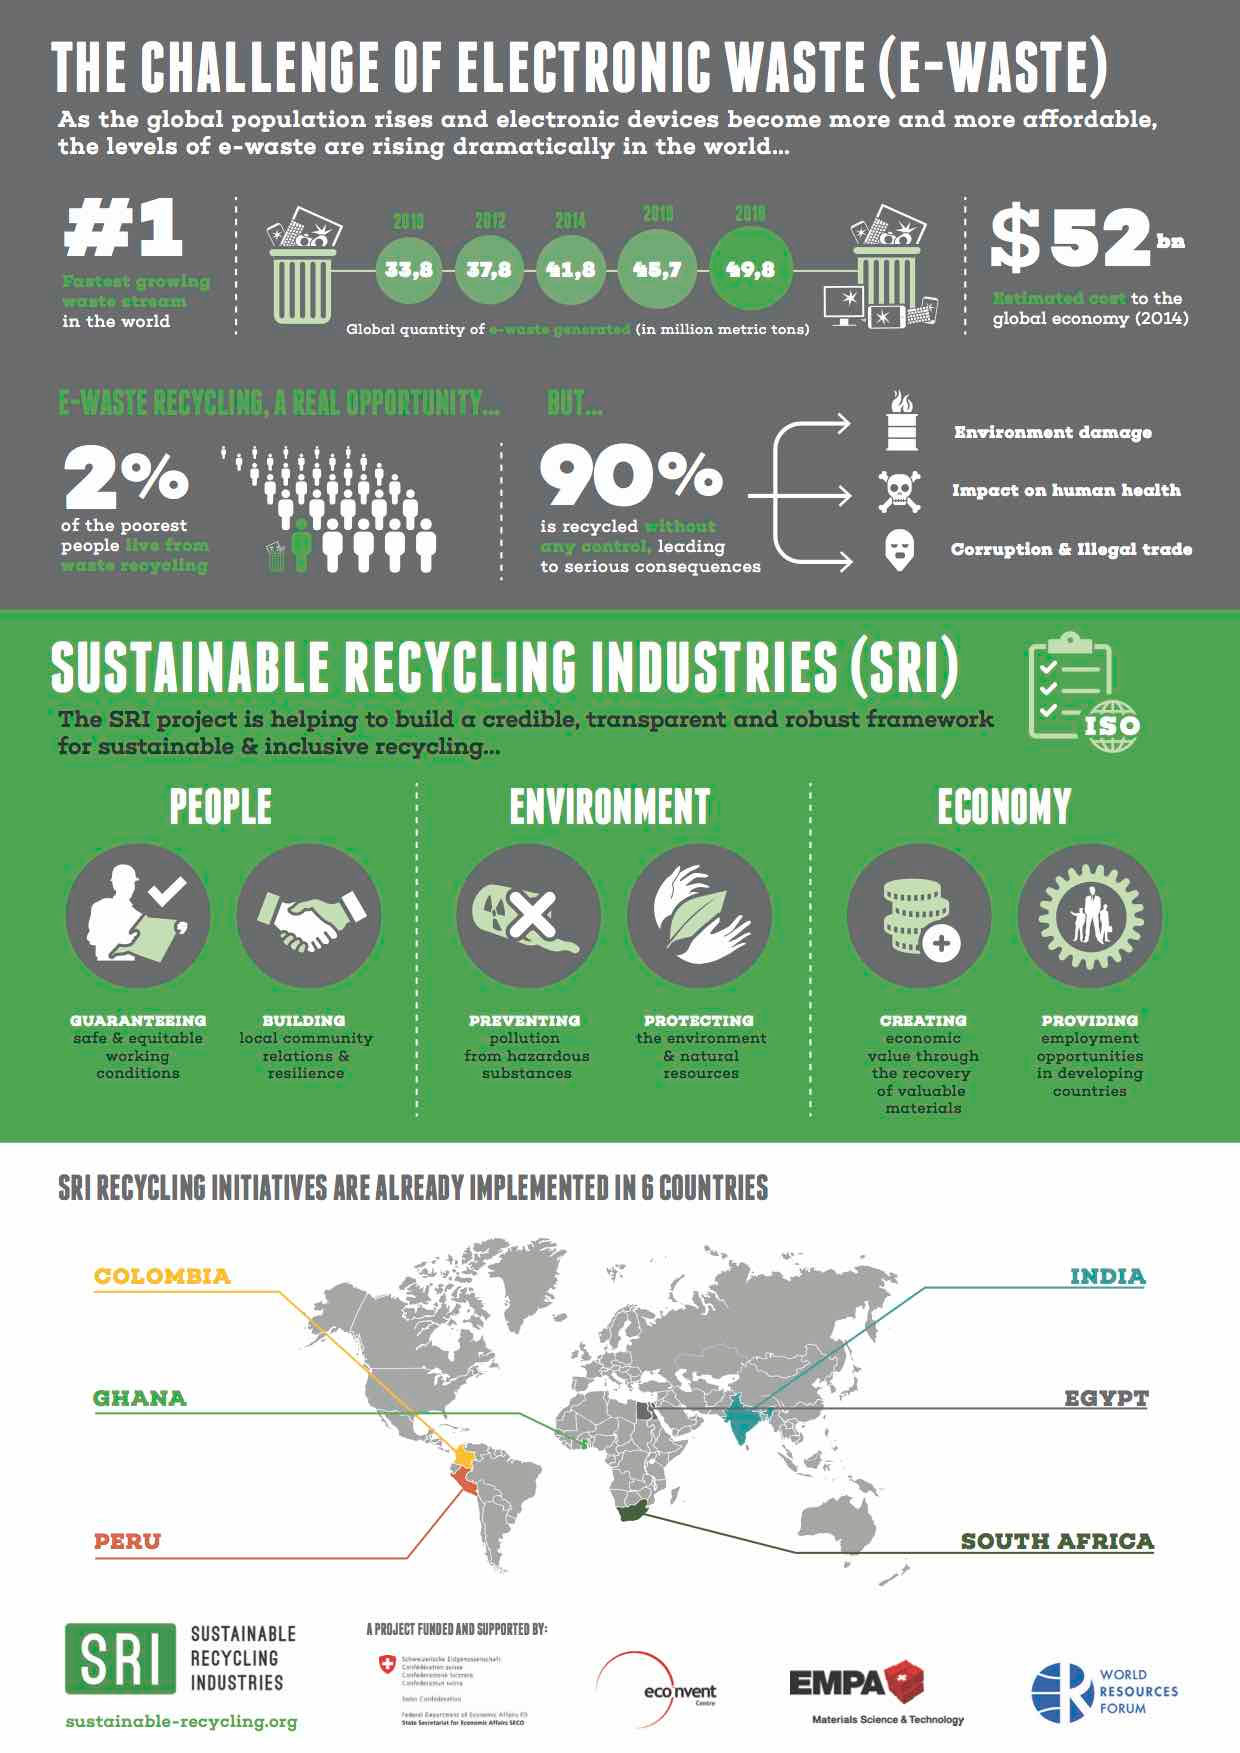
Image Source: sustainable-recycling.org
The SRI is an environmental initiative tasked with helping the developing world — where the rich countries ship their e-waste — build sustainable recycling capacities.
28. How to dispose of old electronics
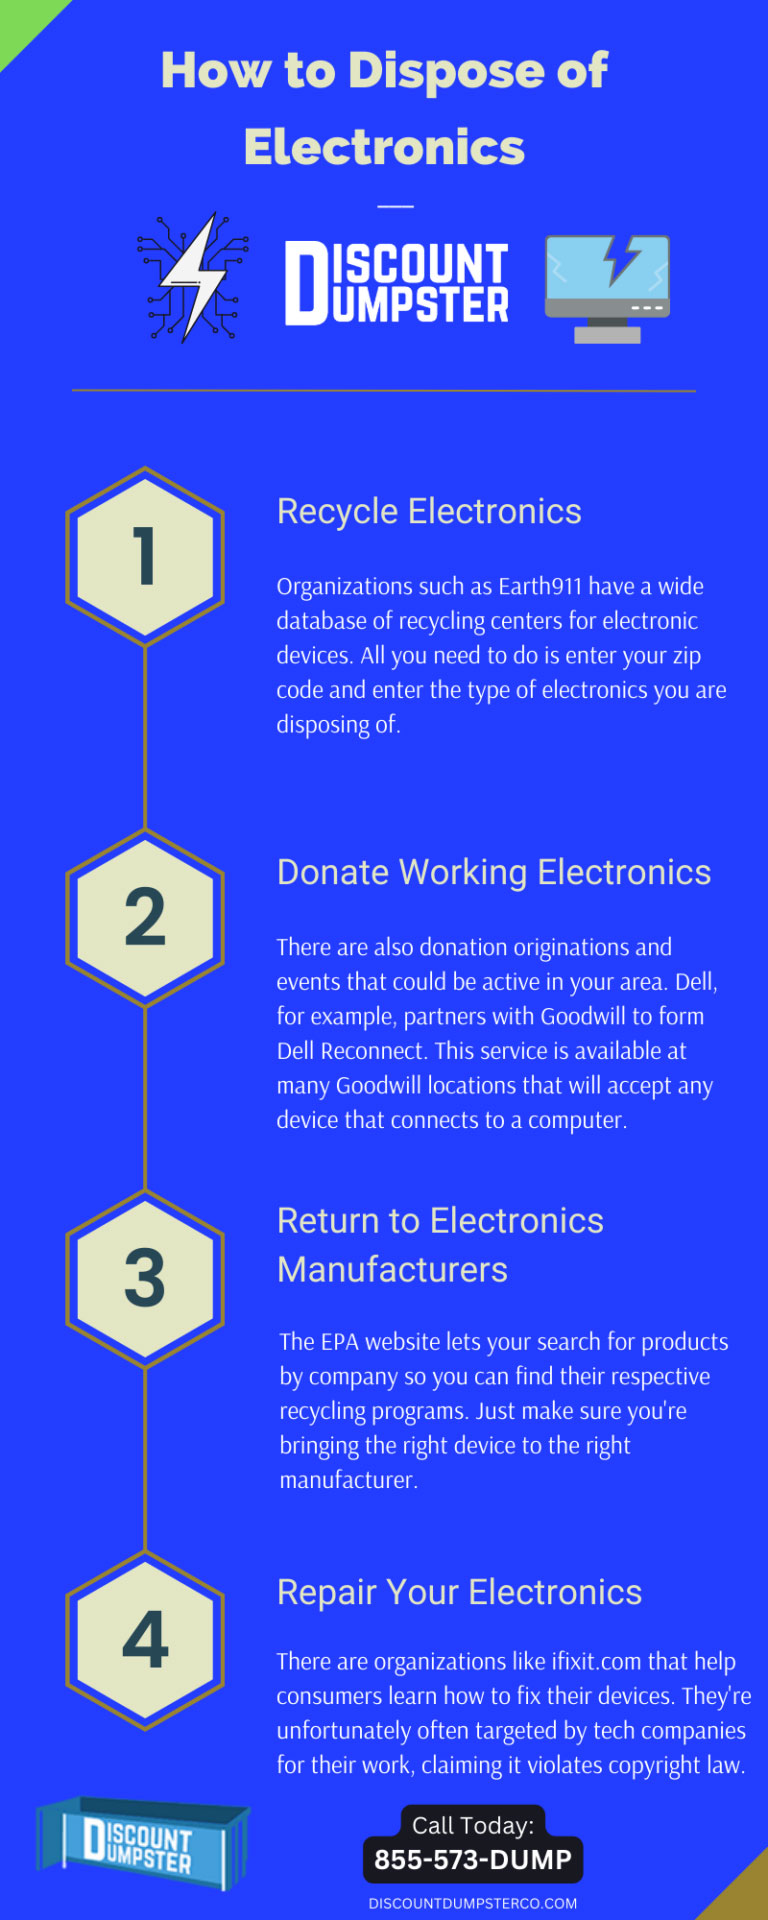
Image Source: discountdumpsterco.com
Old electronics contain a considerable quantity of hazardous materials. Disposing of them improperly exposes the environment to all sorts of toxic leaks and harms. This infographic lays out the rules and processes of responsible e-waste recycling clearly.
29. Effects of Improper E-waste Disposal
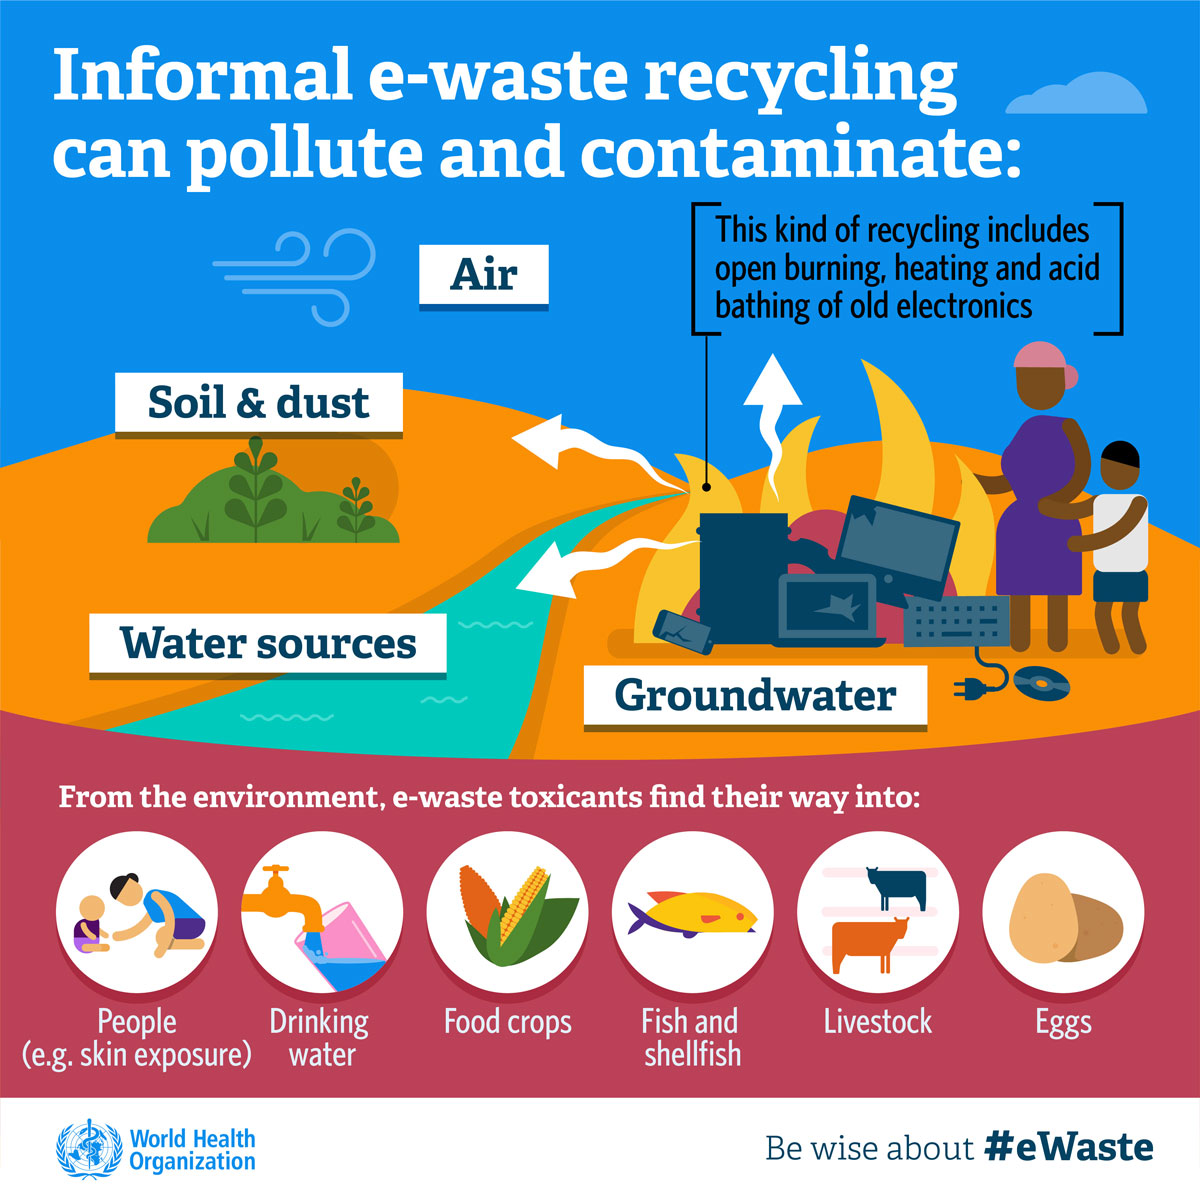
Image Source: who.int
When we aren’t careful about our e-waste disposal, it can cause serious concerns for the environment and communities near the disposal sites. Take a look.
30. Rise of sustainable shopping

Image Source: blog.sendle.com
Not only consumers are eager to recycle more, but they are also looking for ways to address the root cause of the problem. One way they are nipping this evil in the bud is to shift towards more sustainable ways to live and shop.
31. Rise of sustainable web

Image Source: hostgator.com
Did you think that sustainability shifts were limited to recycling and shopping? Think again. Environmentally conscious brands and designers are leading the charger towards a greener world wide web.
32. Rise of sustainable finance

Image Source: sustainalytics.com
Sustainable finance refers to investing in environmentally sustainable projects. Over the years, more and more investors and financial institutions have started to support climate-focused initiatives, strengthening the sustainable finance industry.
33. Rise of sustainable brewing

Image Source: custommade.com
Breweries and wineries are one of the least sustainable industries in the world. At the moment, there are potentially zero breweries globally that could call themselves 100% sustainable. Almost all of them consume more resources than they give back to the planet. Yet, some of them are trying to change that. Let’s see how.
34. Rise of sustainable packaging
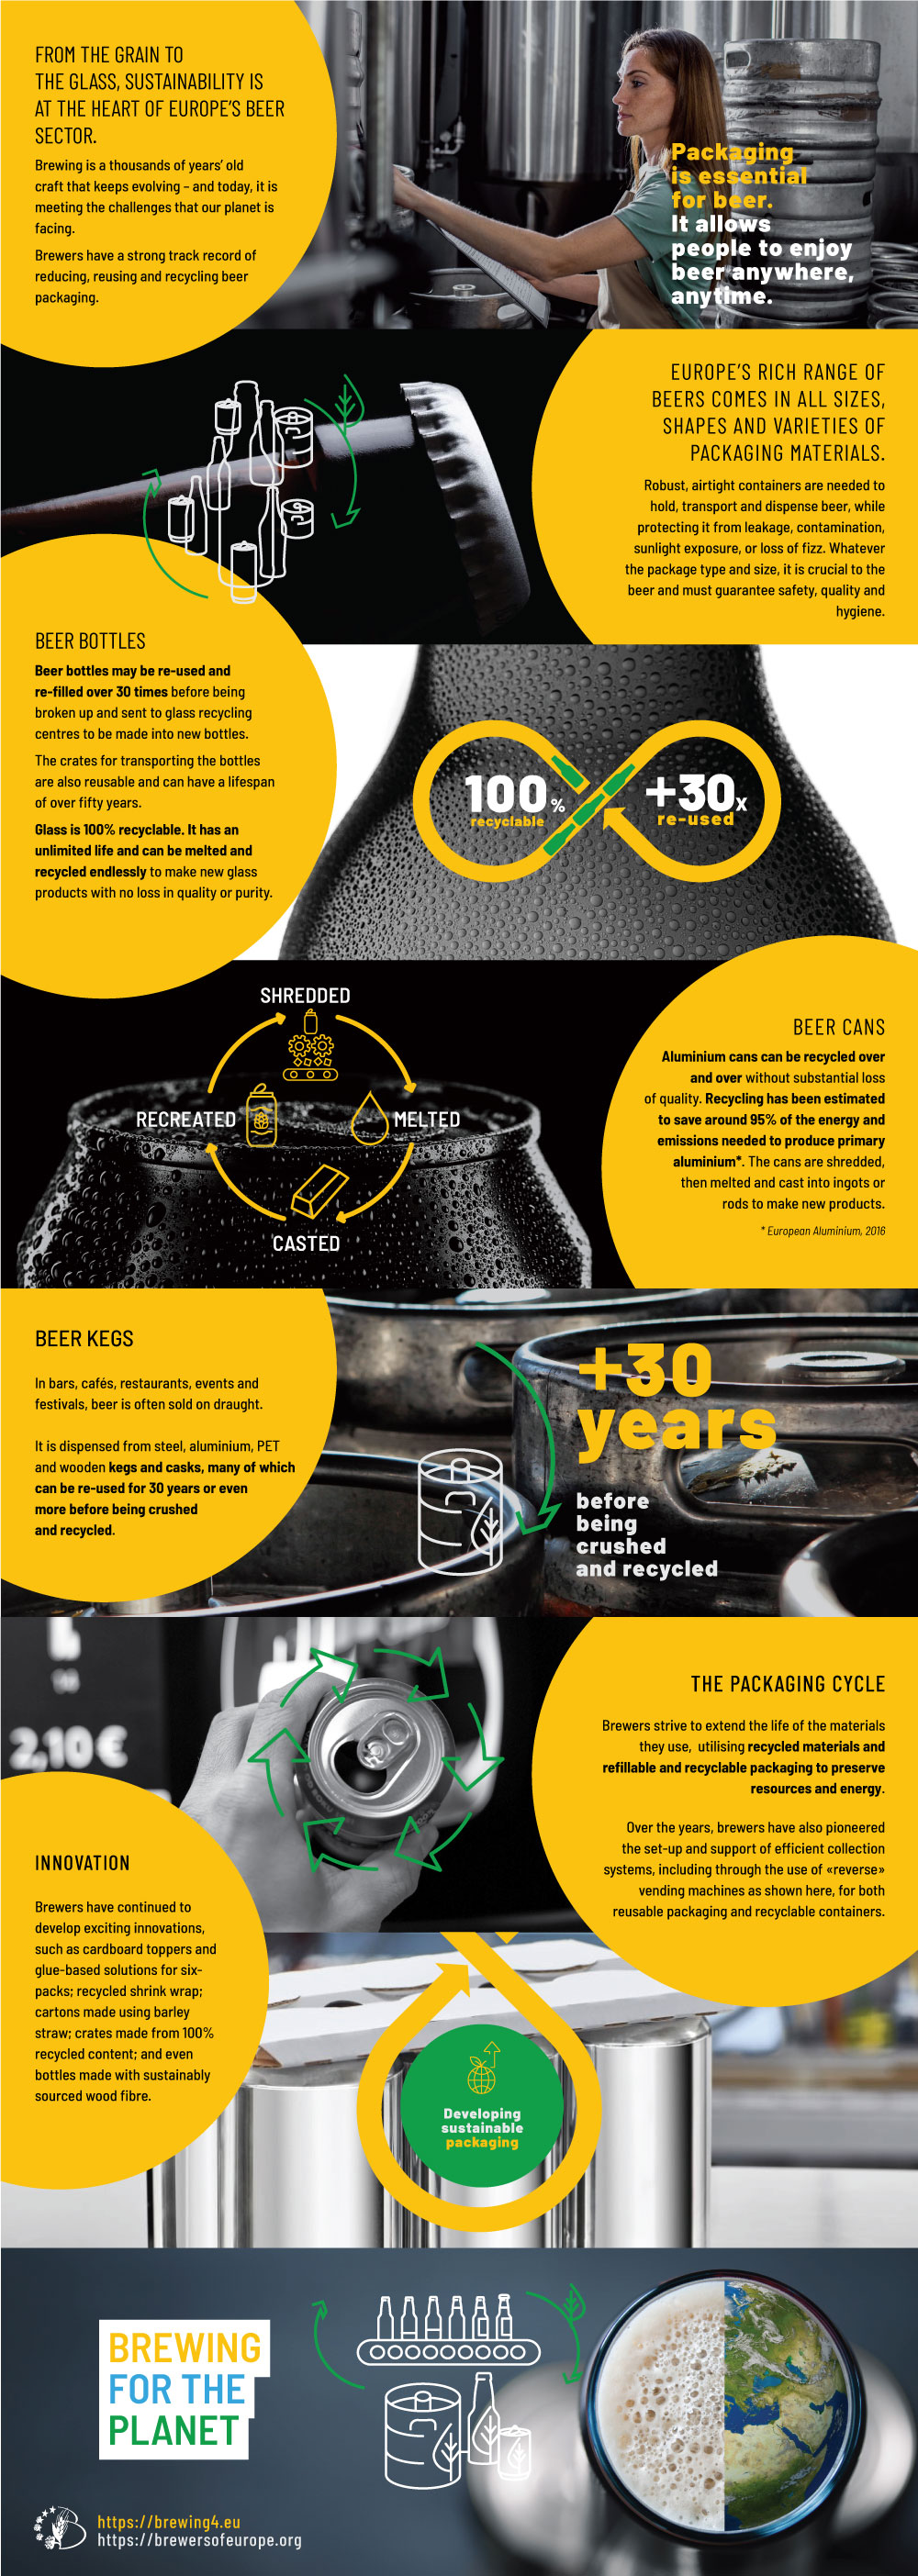
Image Source: brewersofeurope.eu
Businesses are looking to explore lasting and environment-friendly ways to package and process their products. The infographic below sheds light on Europe’s brewing industry’s foray into sustainable packaging.
35. The rise of sustainability in the supply chain
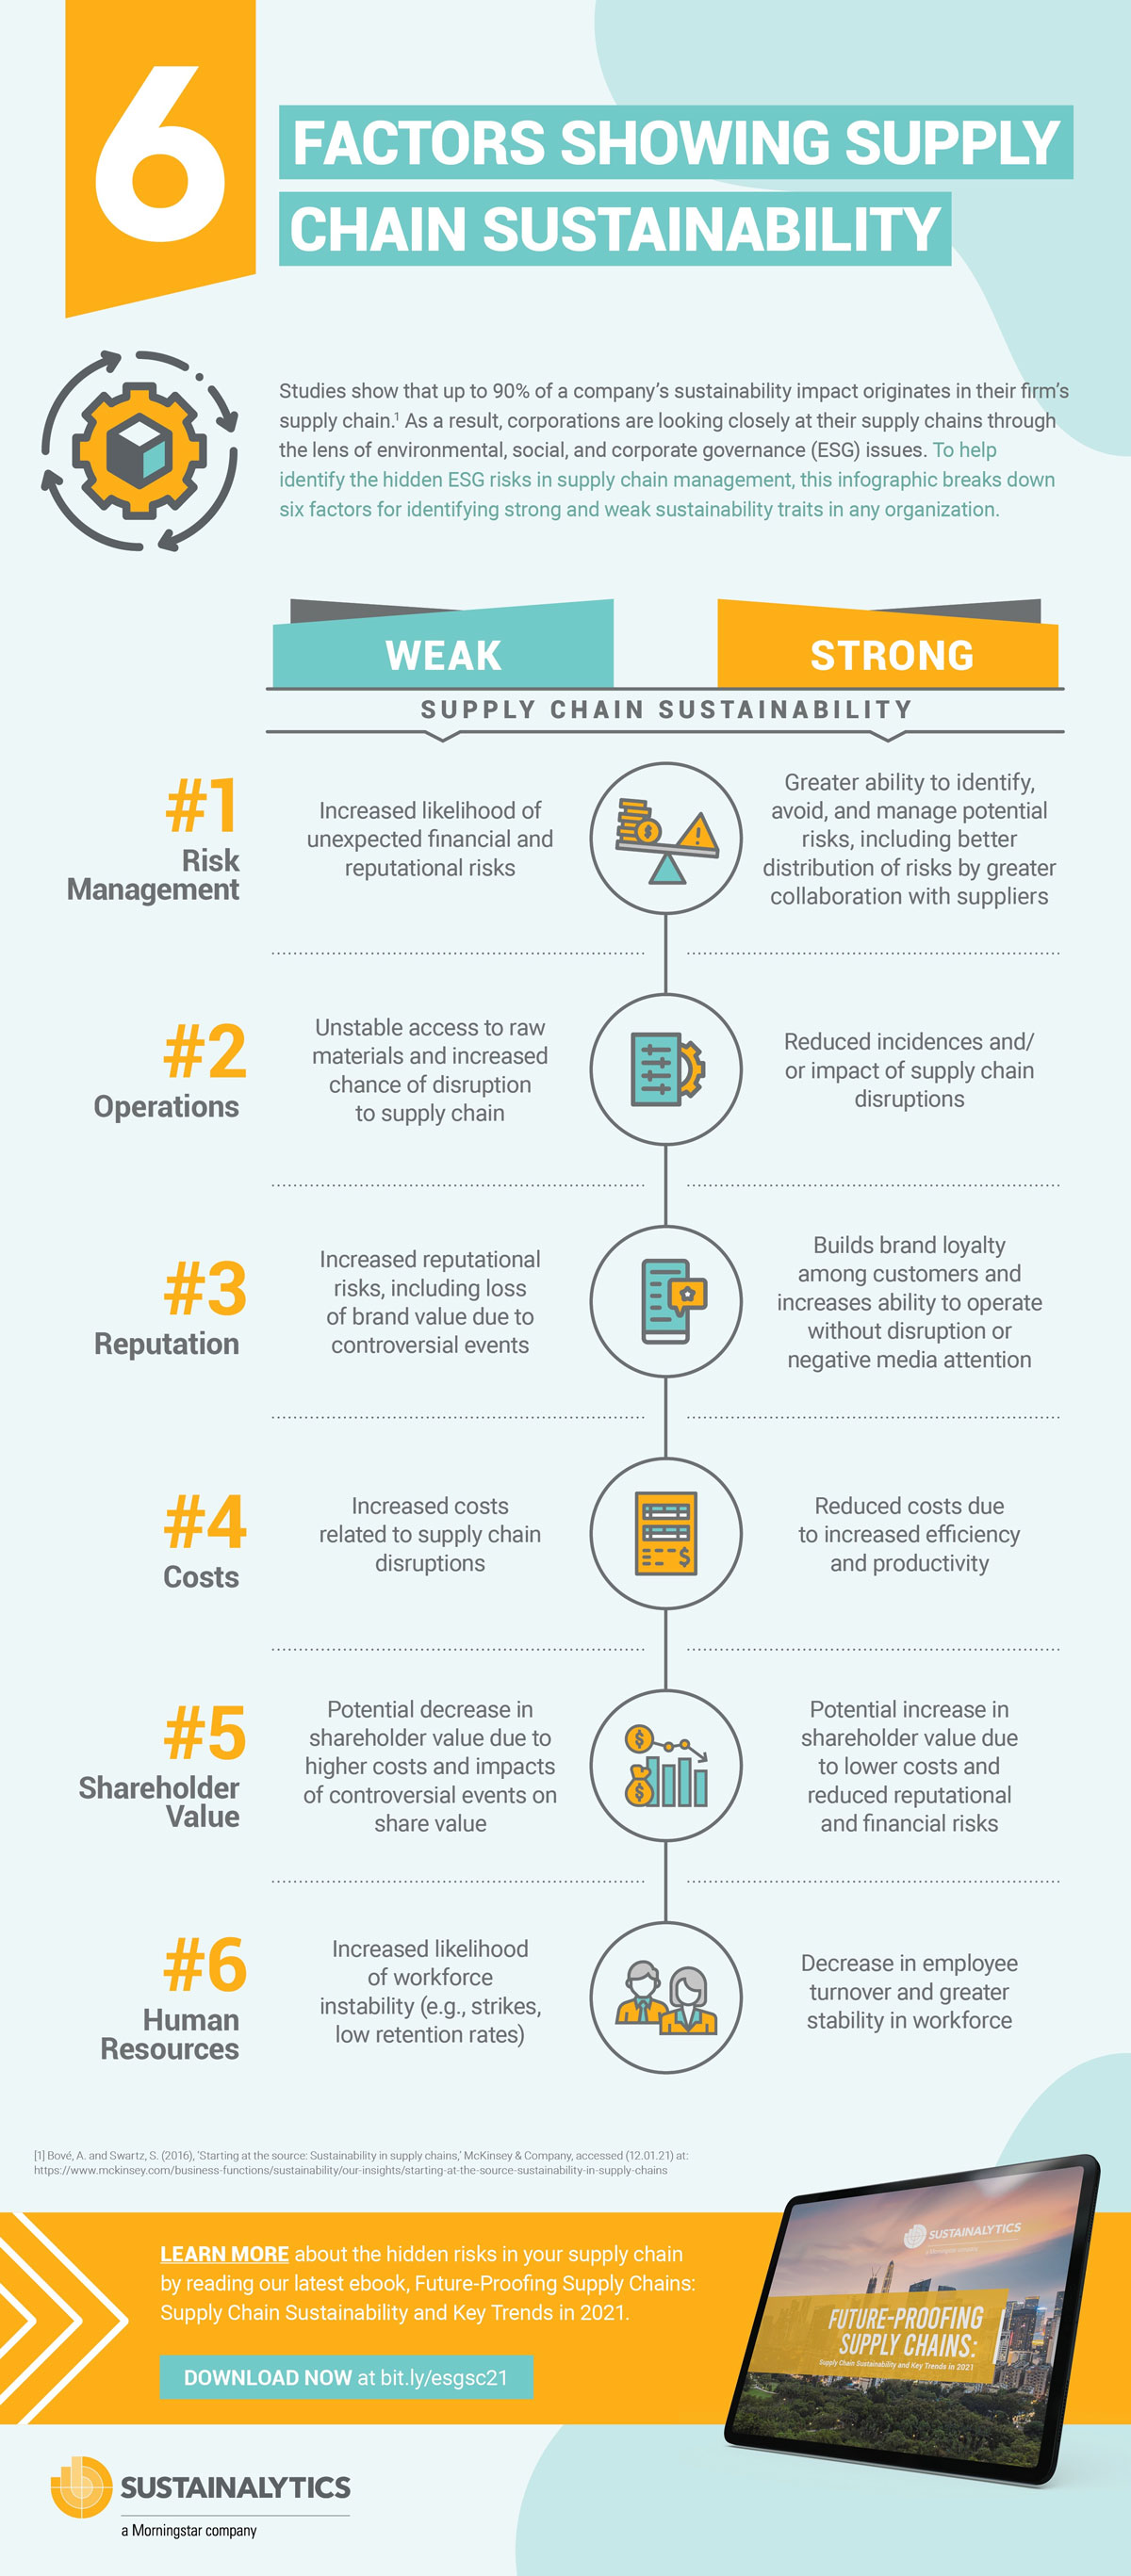
Image Source: sustainalytics.com
For businesses to become sustainable, it starts at the bottom with the supply chain. This infographic identifies 6 factors that impact the efficiency and sustainably of the supply chain most strongly.
36. E-waste in the workplace

Image Source: seamservices.com
Commercial e-waste generated by businesses puts a tremendous amount of pressure on IT disposal and recycling systems. Take a look at the infographic below to see how it happens.
37. Paper waste in the workplace
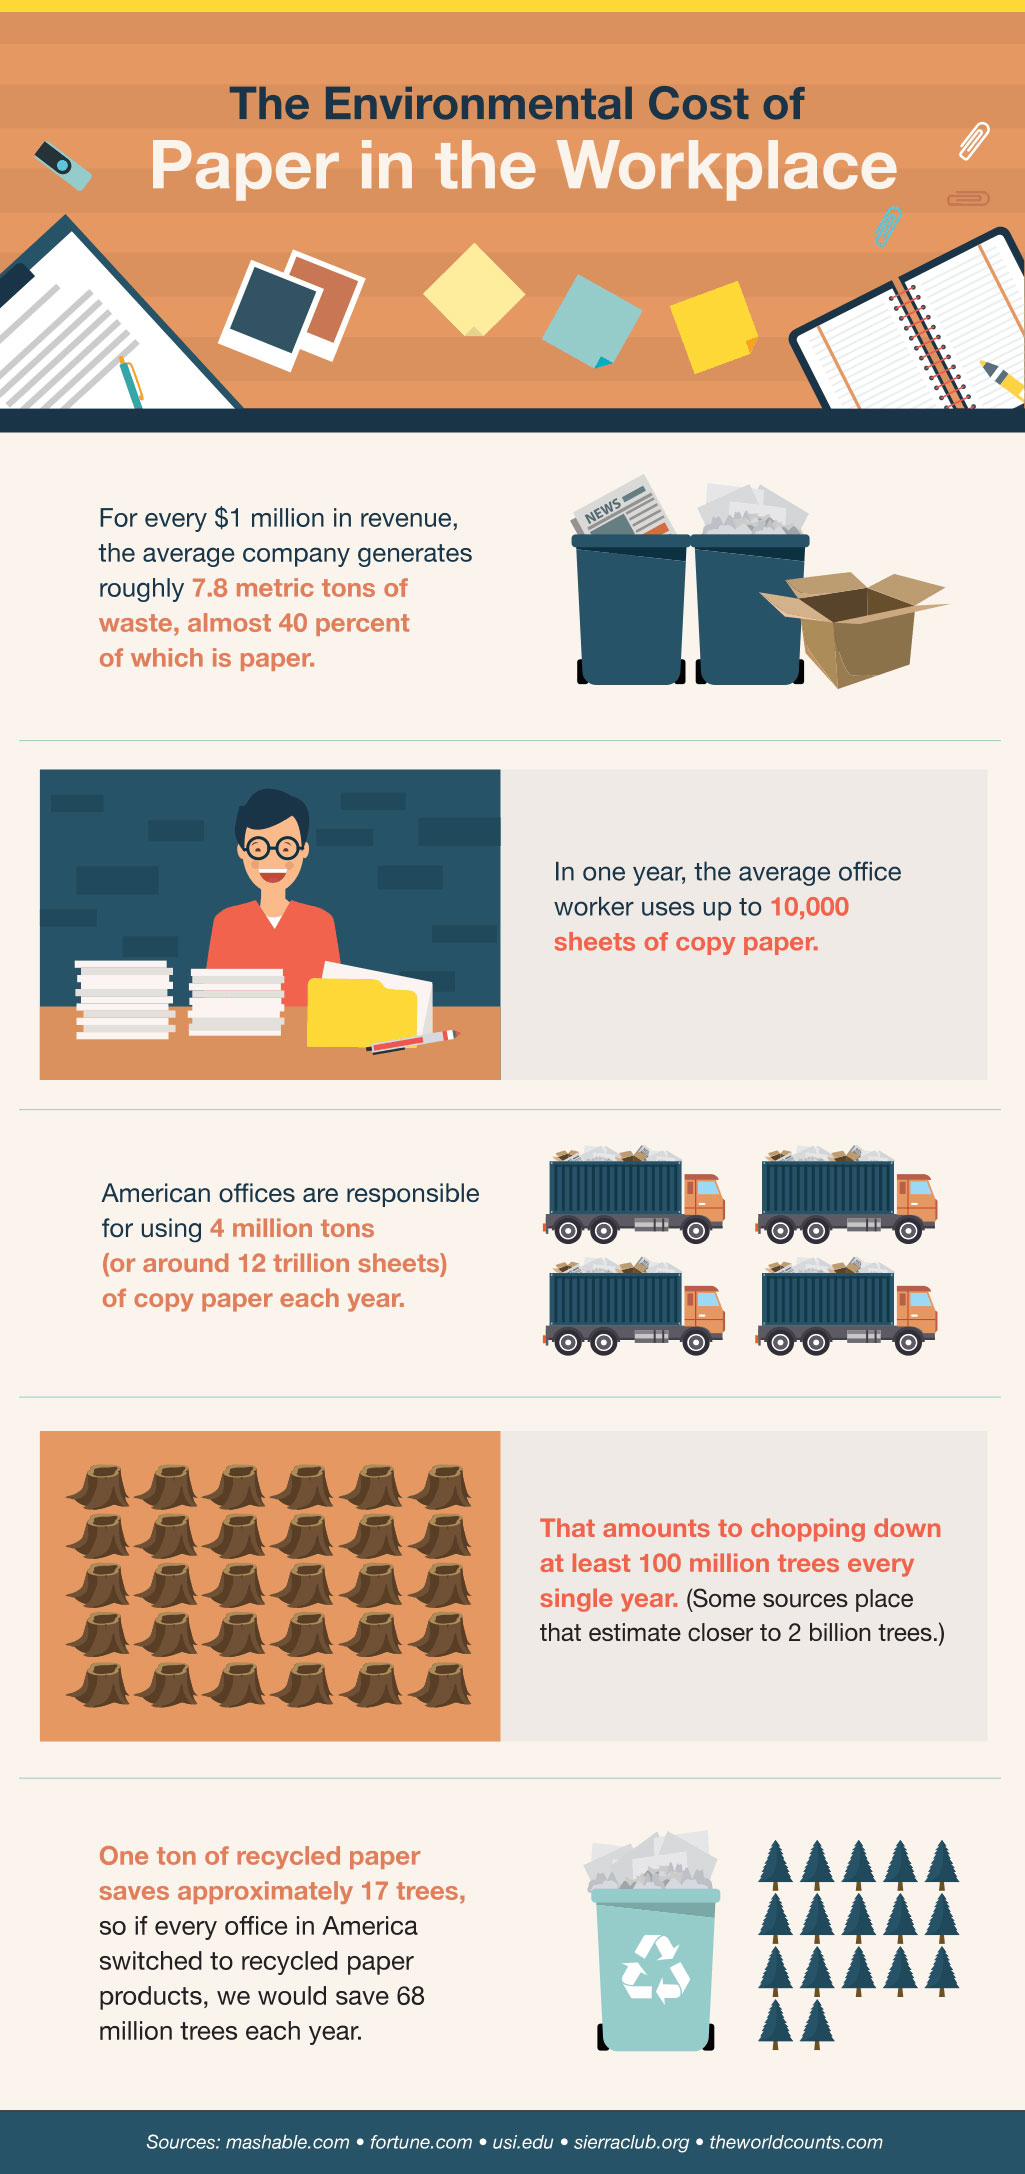
Image Source: greenerideal.com
Even though our workplaces have become more digitized, paper still plays a large role when we do creative work, attend meetings, or print important documents.
Learn about its impact on the environment.
38. 7 reasons why being sustainable is good business
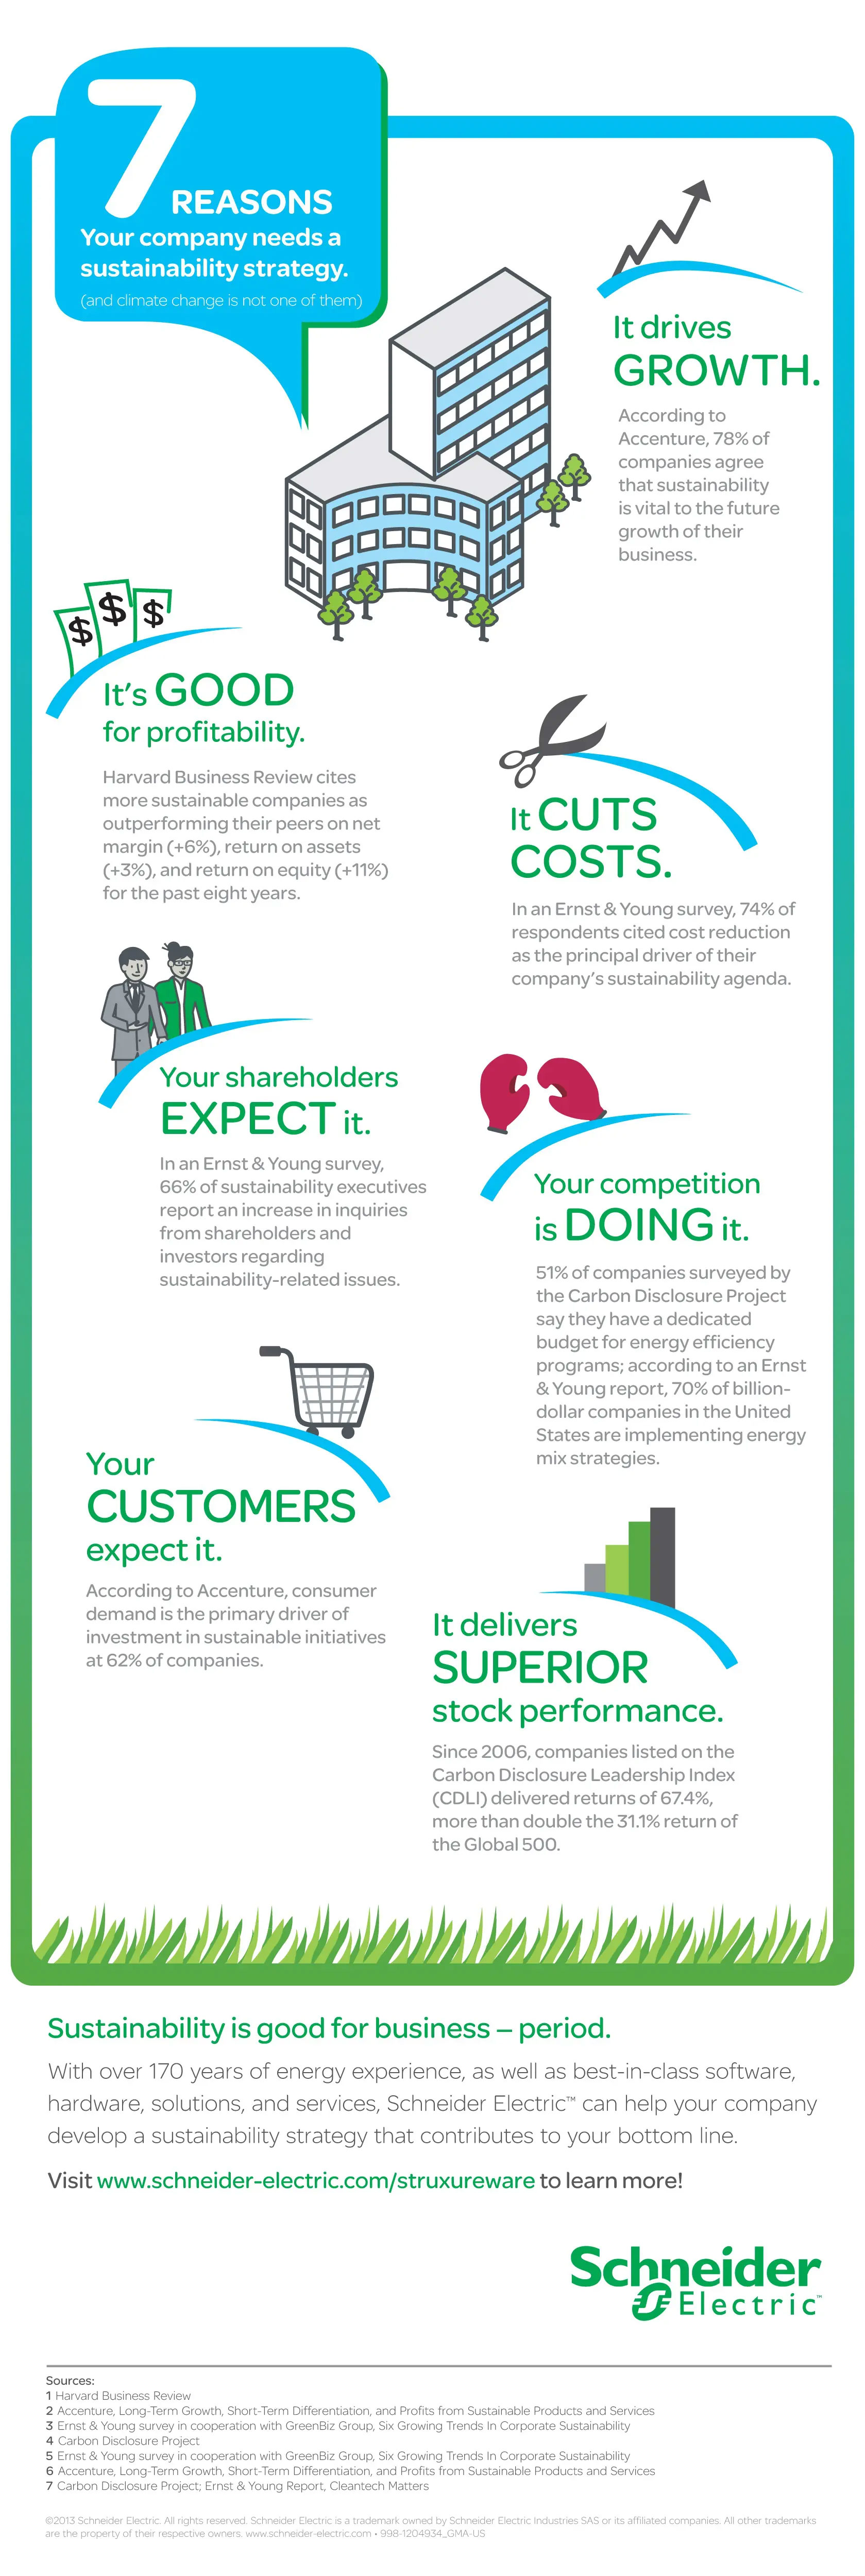
Image Source: blog.se.com
Take a look through this infographic to learn why caring about the environment makes good business sense.
39. Benefits of improved environmental performance
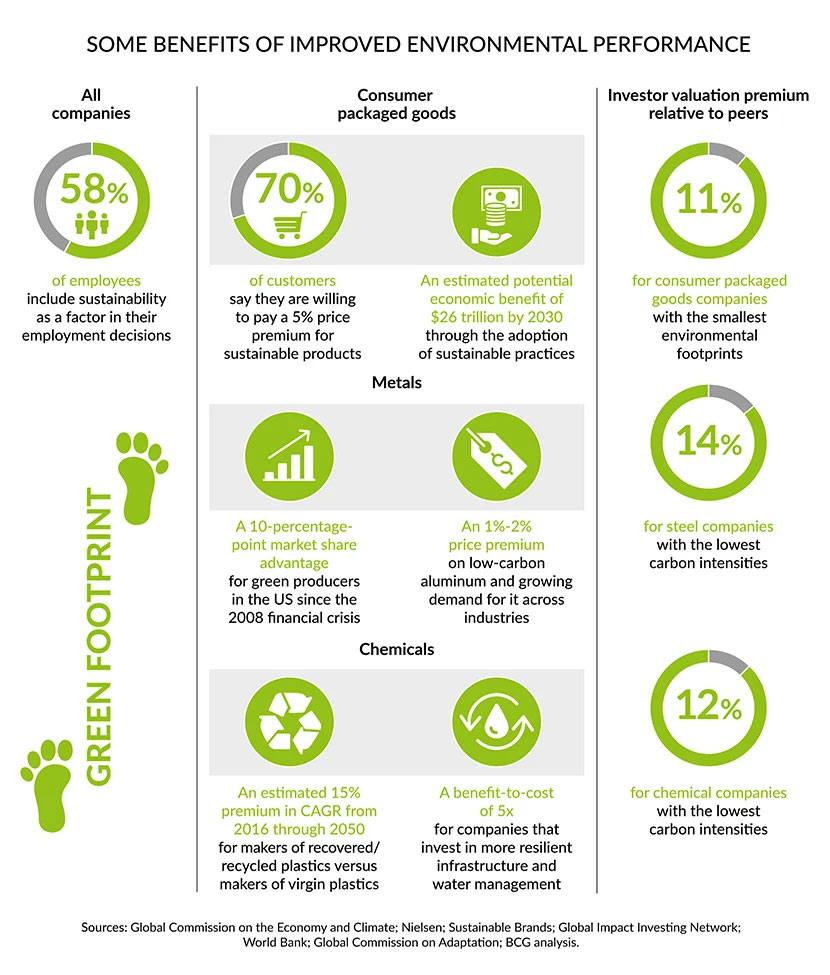
Image Source: blog.flexis.com
From premium prices to premium investor valuations, this infographic details some of the financial benefits of being an environmentally friendly business.
40. Business benefits of recycling

Image Source: skip-hire-durham.co.uk
Businesses that prioritize recycling enjoy high team morale, attract the best talent, and also maximize their profits. Learn what else good recycling brings your way.
41. Perks of being an eco-friendly company

Image Source: ecogreenlove.com
Customers and investors are increasingly shifting towards companies that prefer the environment over corporate greed. To position yourself as such a brand, here are some perks to attract you and simple how-to to guide you.
42. Forest Stewardship in Canada

Image Source: blog.resolutefp.com
Resolute is a paper and power generation company operating in Canada and the U.S. In this infographic, Resolute shares how it protects the woodlands and forests it benefits from and keeps its environmental impact at the minimum.
43. Reducing corporate impact on the environment

Image Source: globalfurnituregroup.com
This one company is sharing how it reduces and minimizes its environmental footprint to sustain a better and greener planet for all.
44. The basics of recycling

Image Source: globaltrashsolutions.com
Learn the basics of recycling including the recycling loop, everyday items that are easily recyclable, and the purpose behind the recycling movement.
45. Living the zero-waste life

Image Source: zero-waste-creative.com
The zero-waste life refers to living lightly on the planet. People who adopt this lifestyle consume earth’s natural resources more carefully (as they are limited), and minimize the negative human impact.
46. Simple ideas to reduce e-waste
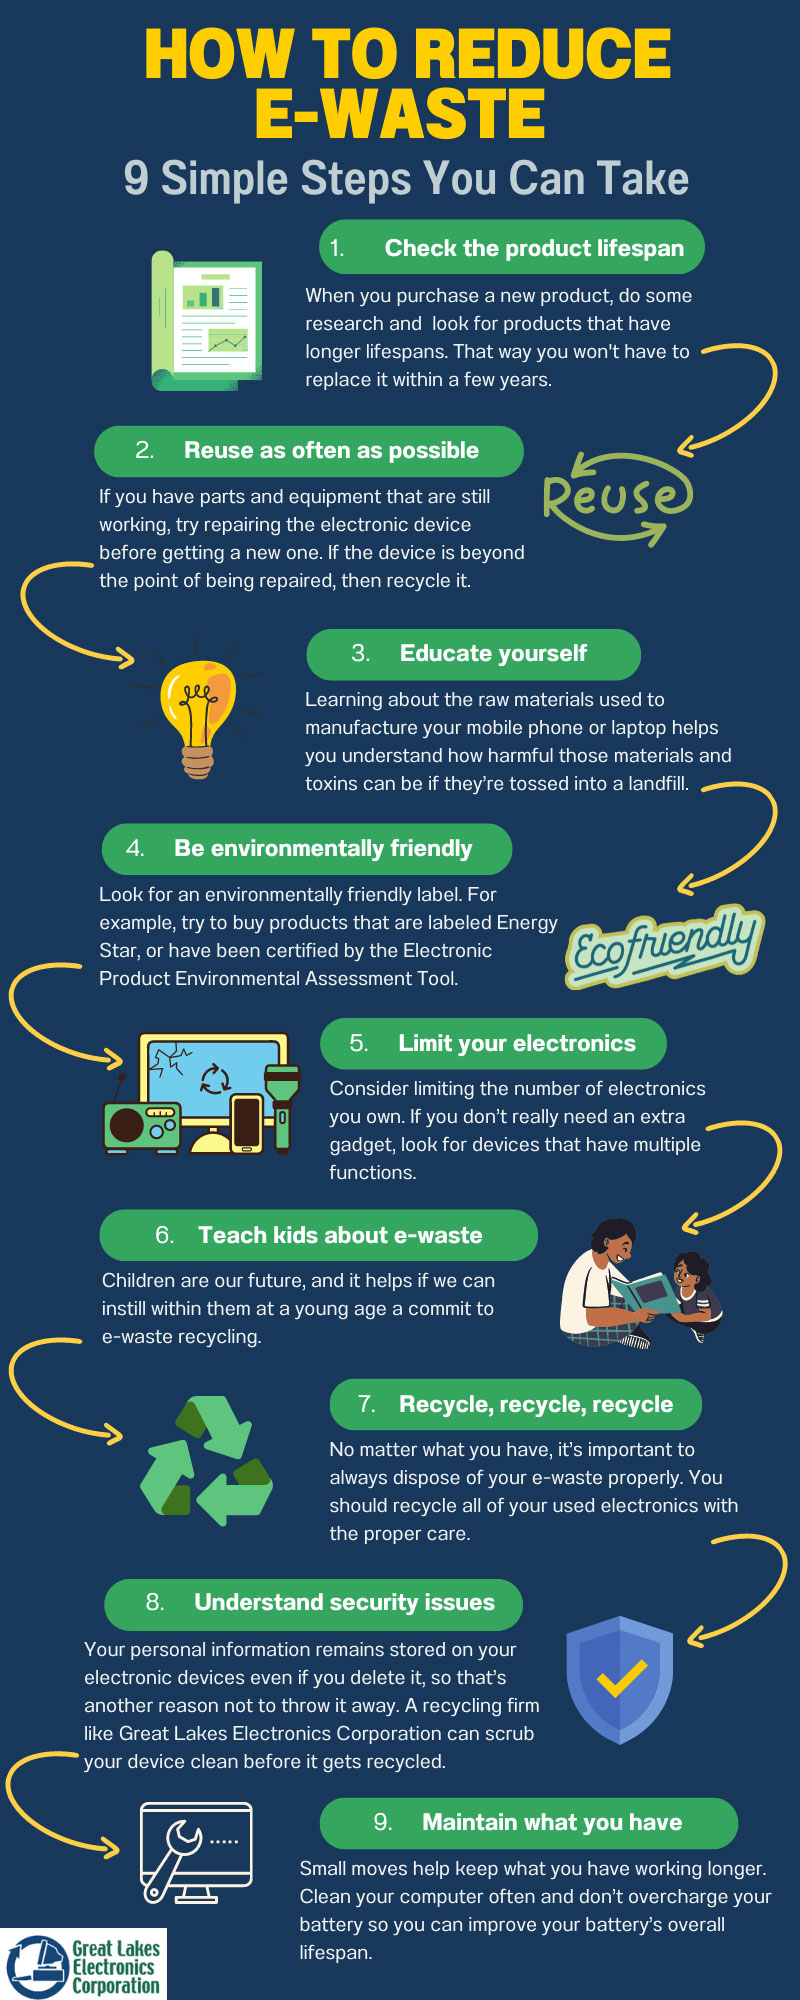
Image Source: ewaste1.com
While e-waste is certainly a complex issue, the path to solving it doesn’t have to be complicated. Start with these small changes in your life to thrive as an eco-friendly citizen.
47. How does e-waste recycling work
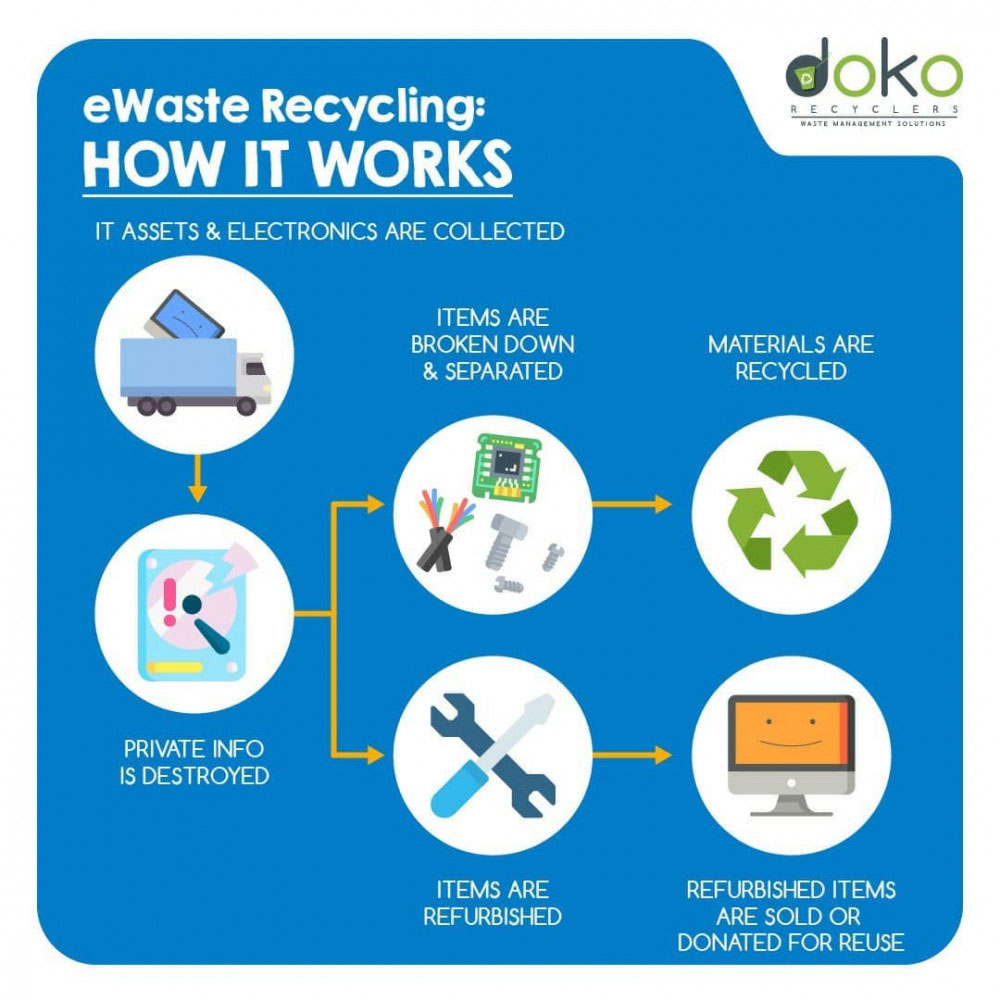
Image Source: dashboard.dokorecyclers.com
Curious to learn what goes on behind the scenes when you send off your old laptop for recycling? Find out in this short and sweet illustration.
48. The global face of e-waste recycling
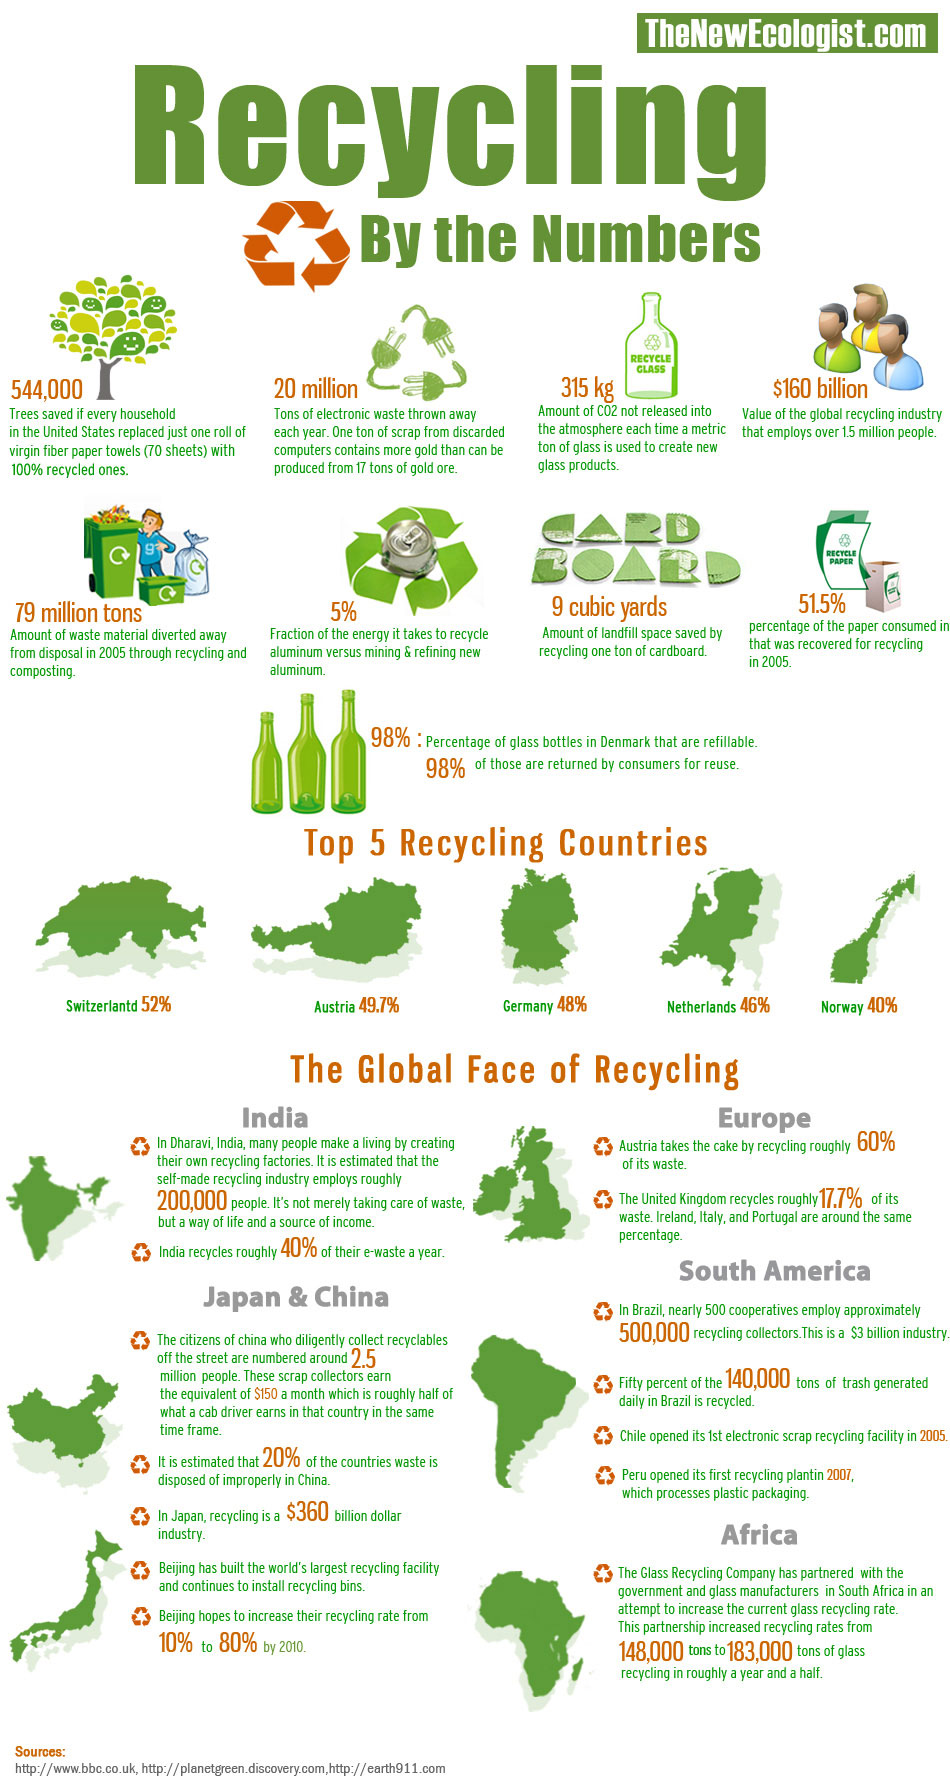
Image Source: harmony1.com
Austria recycles almost 60% of its waste a year. India, around 40%. What about other countries?
49. Types of recycling bins
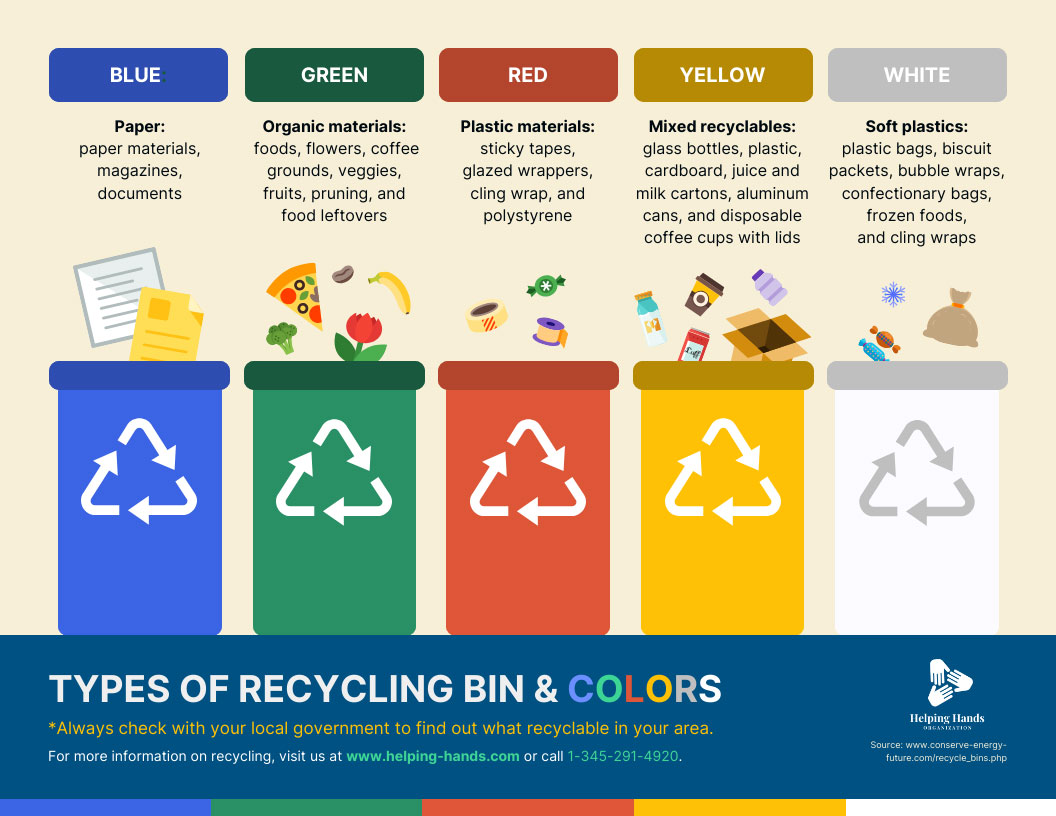
Image Source: venngage.com
Recycling bins are color-coded to help citizens sort their recycling items more carefully. Learn what each color represents in the recycling world.
50. Recycling symbols
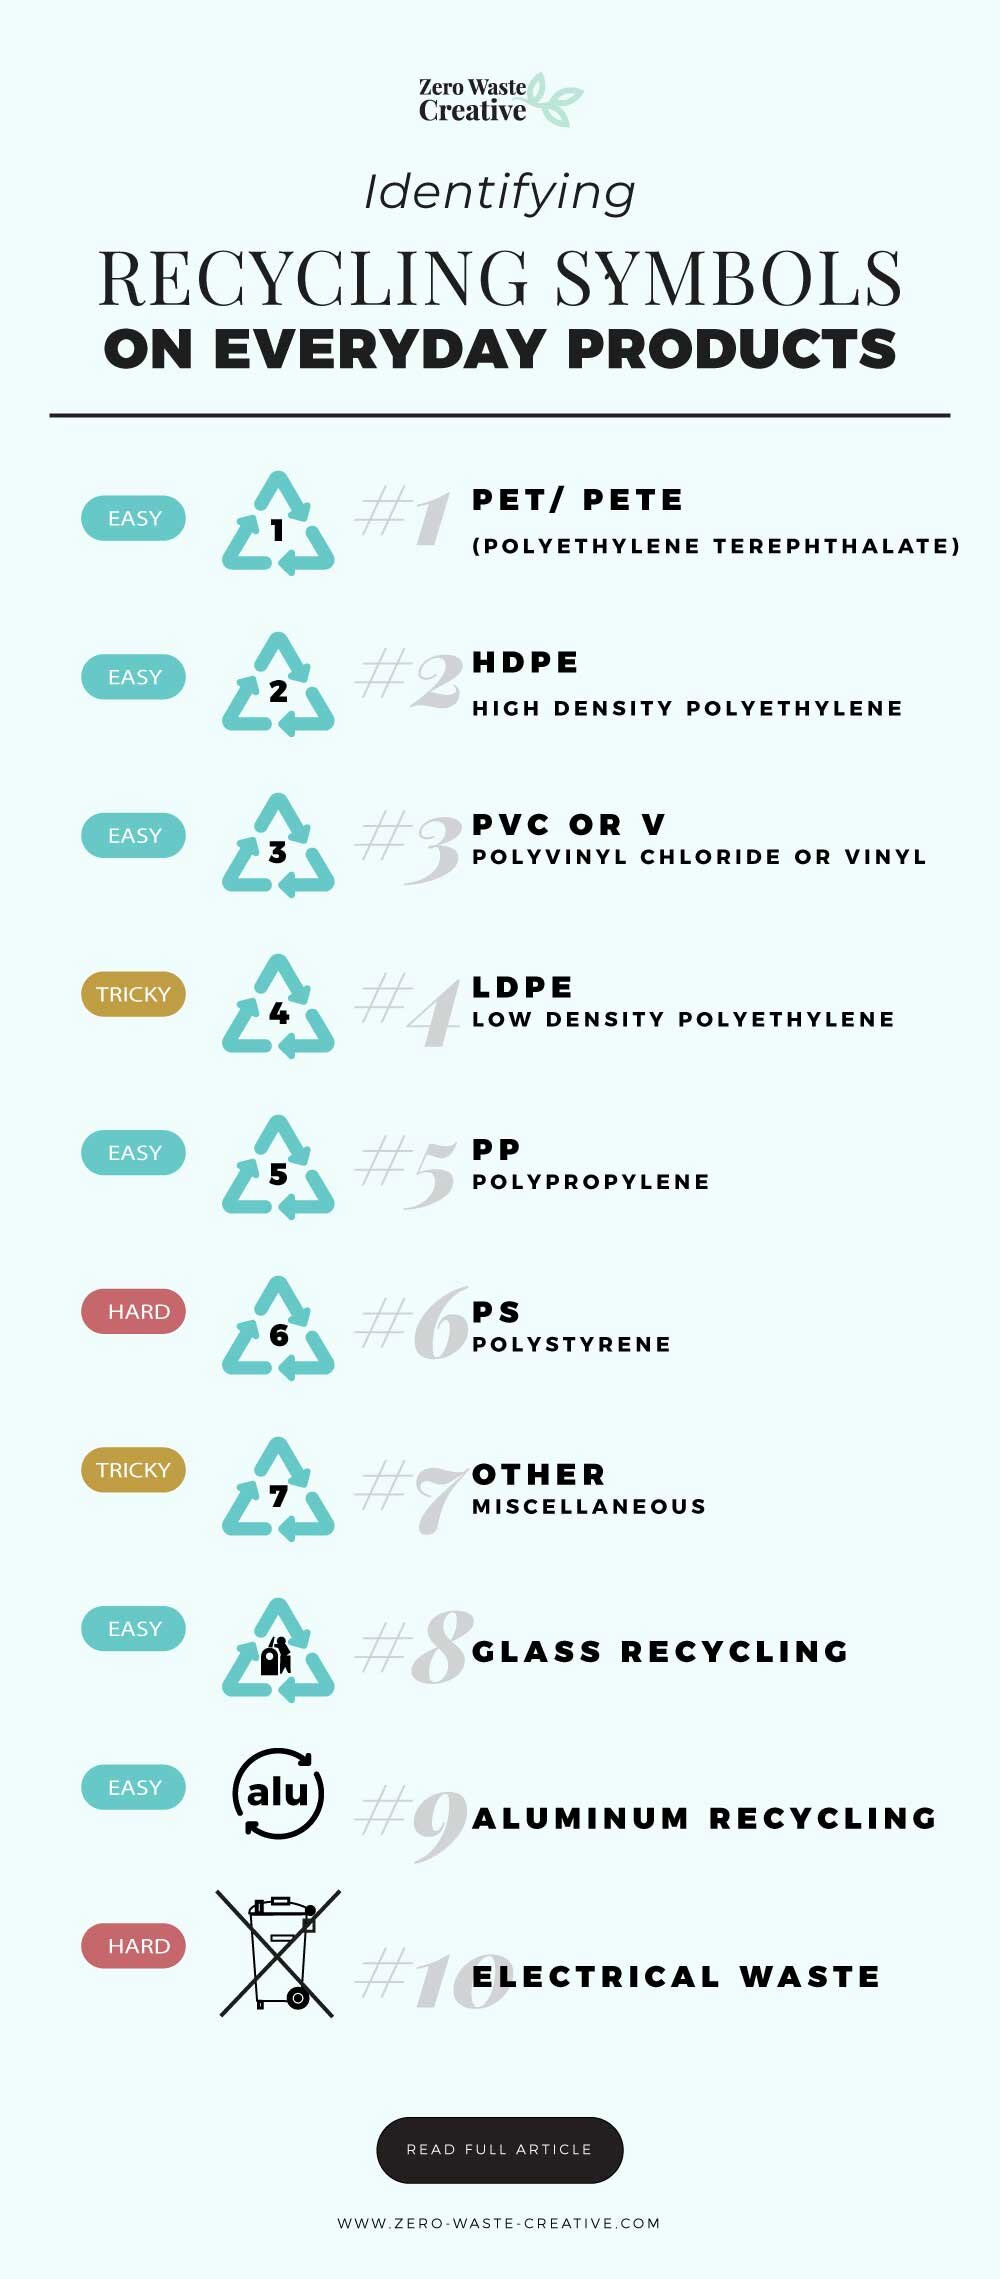
Image Source: zero-waste-creative.com
Not all products are recyclable and sorting the useful from the unusable is critical in efficient recycling. To achieve that, standardized symbols are used to denote products that can be recycled and in what category.
51. Some more signs to understand recycling

Image Source: ecogreenitrecycling.co.uk
Since recycling can be a broad topic, here are some more symbols to help you understand municipal waste and e-waste recycling better.
52. 5 Quick Recycling Facts
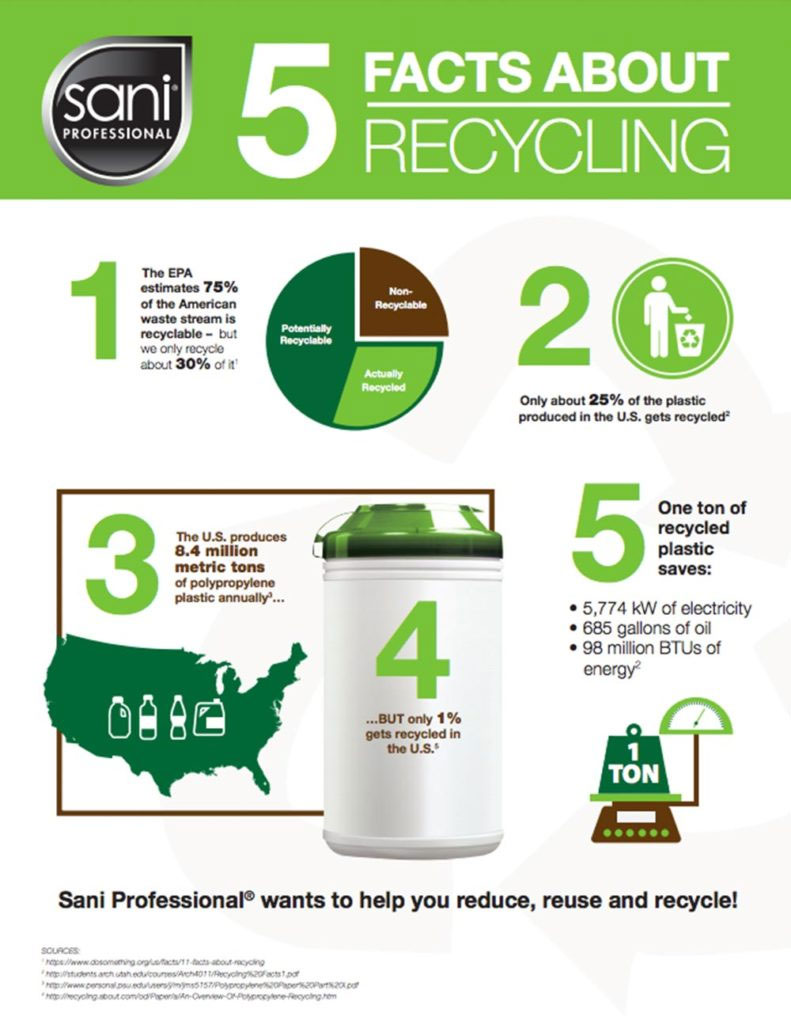
Image Source: saniprofessional.com
This bite-sized infographic gives you a snap preview of what we are dealing with when fighting against the e-waste crisis.
53. Recycling by the numbers
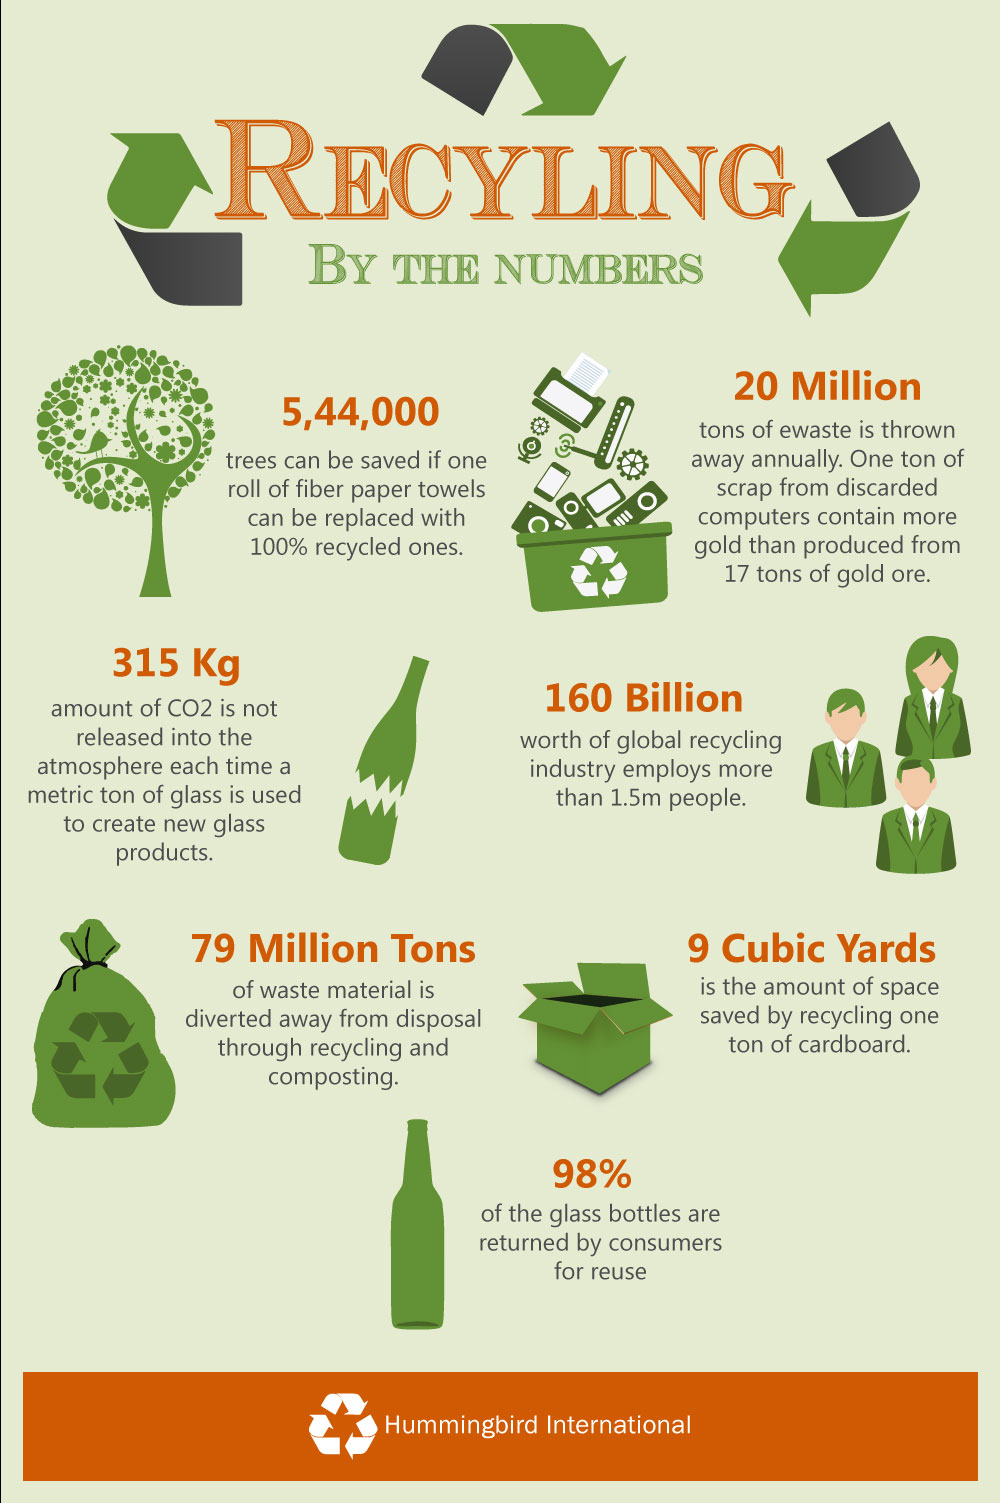
Image Source: hummingbirdinternational.net
How many trees can we save if we replace recycled paper towels with fiber ones? Learn in this infographic.
54. Paper and plastic recycling facts

Image Source: reusethisbag.com
Though we are an e-waste recycling service and e-waste is the fastest-growing waste stream in the world, municipal solid waste (including paper and plastic) continues to be the majority of waste we produce. Here are some numbers shedding light.
55. Recycling is energy-efficient
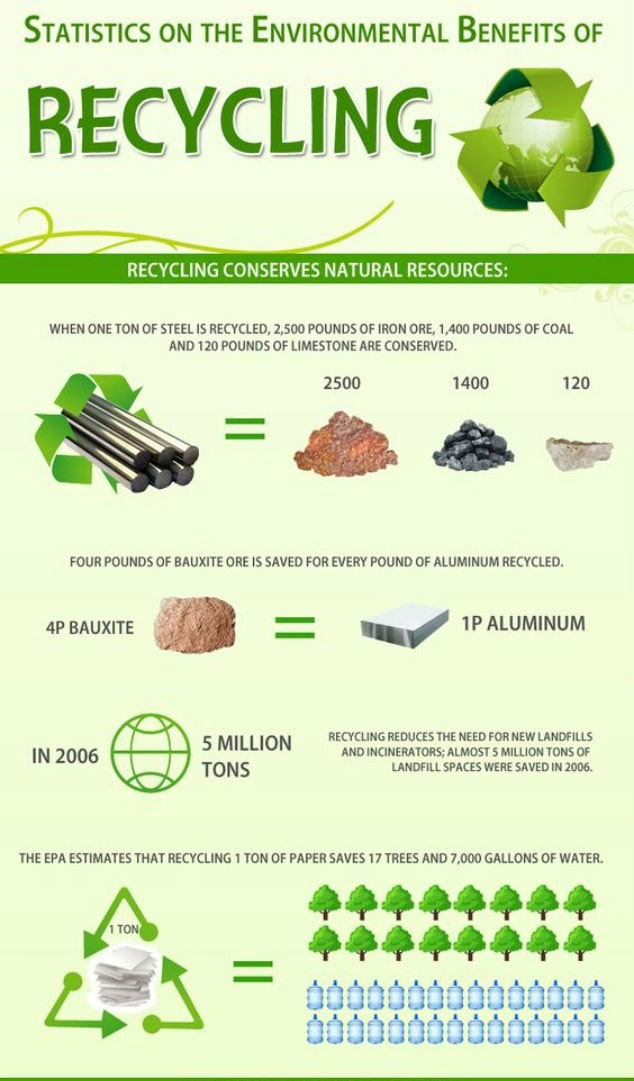
Image Source: familyfocusblog.com
When we recycle electronic and other waste, we save extensive amounts of natural resources including water, glass, energy, gasoline, and more.
56. Recycling: A behind-the-scenes view
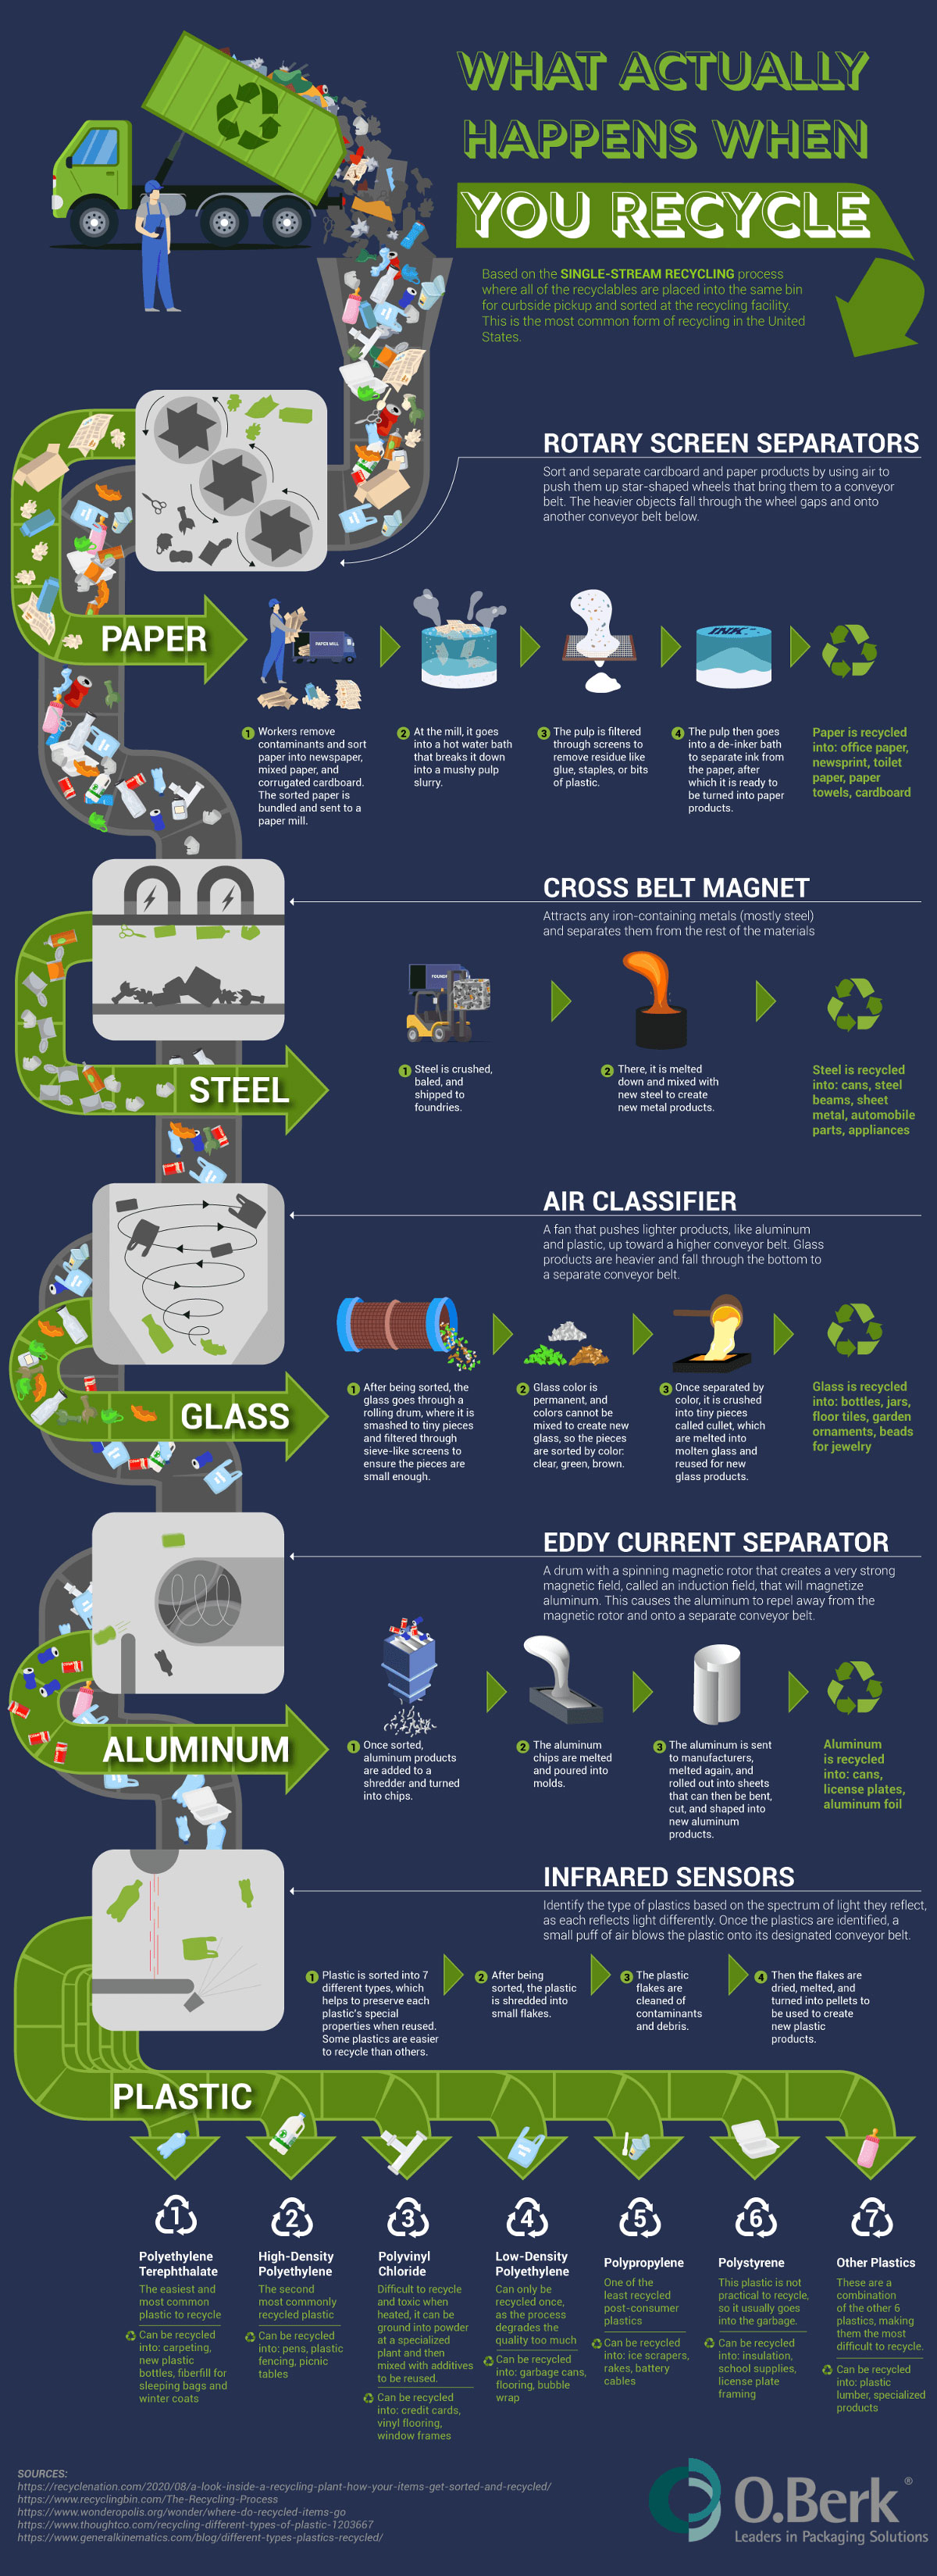
Image Source: oberk.com
What happens when you recycle? A packaging company spills the beans.
57. UK recycling statistics

Image Source: ismwaste.co.uk
The UK is one of the leading nations where citizens are more mindful of climate change and take recycling seriously. These figures share an overall picture of the UK’s recycling culture.
58. E-waste recycling techniques for the future

Image Source: junk-king.com
As we learn more about recycling and discover ways to do it better, we continue to explore technologies that optimize e-waste recycling for all.
59. Is recycling enough?
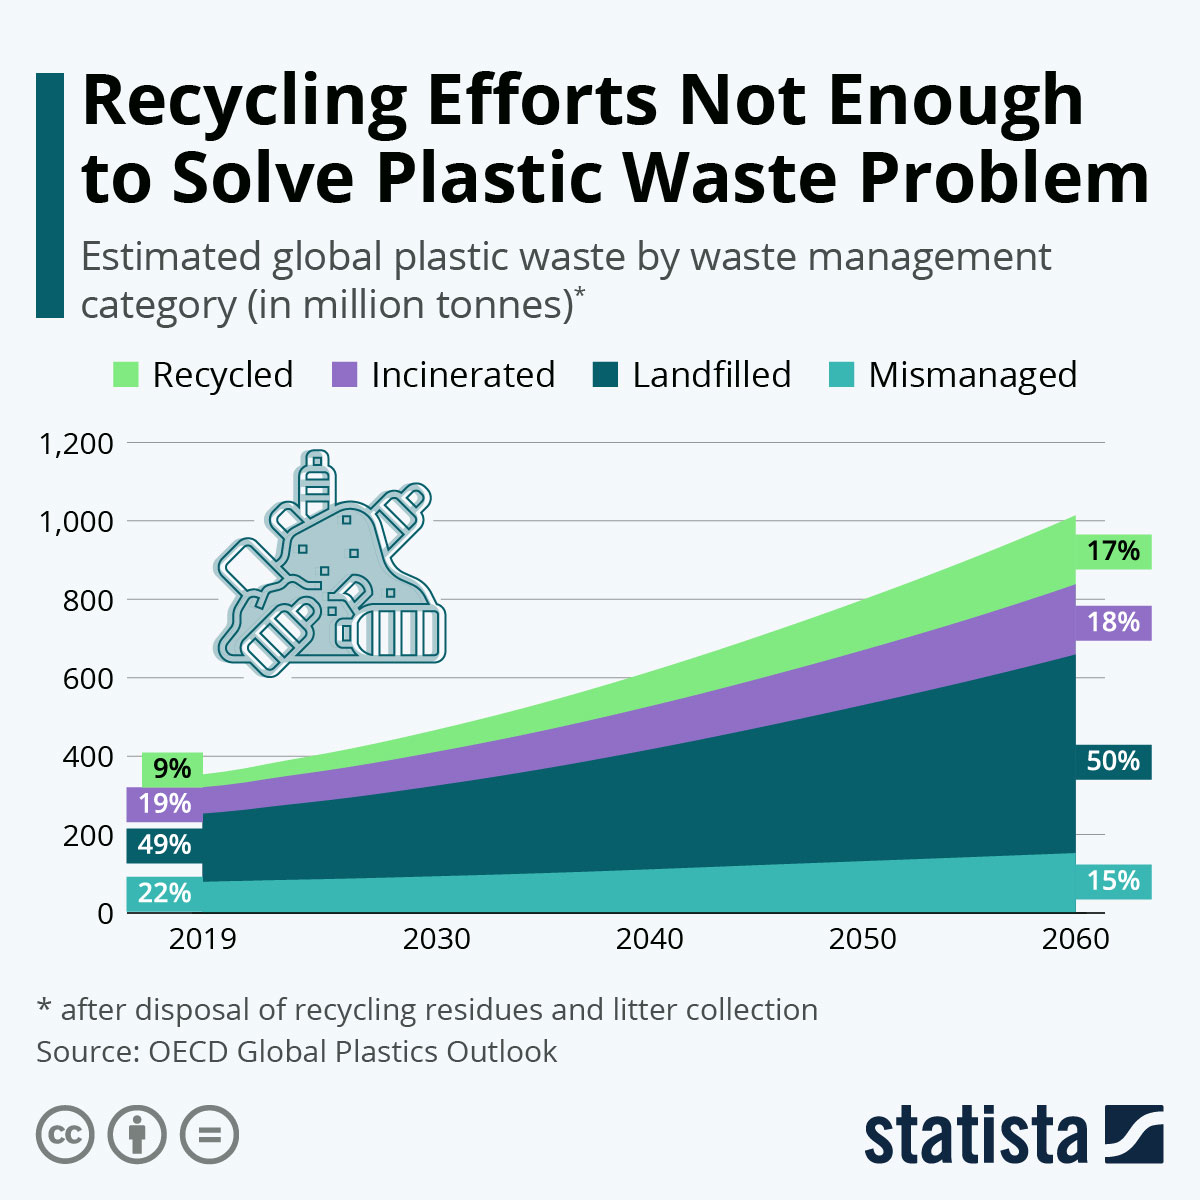
Image Source: statista.com
The world grapples with the mounting waste it generates each year. Does recycling offer the final solution?
60. Why recycling alone is not enough

Image Source: earthbound.report
While recycling is a critical part of the solution, it’s not the ultimate answer to all waste-related woes. A multidimensional approach is needed to prevent waste generation and mainstream the practice of reuse.
61. Plastic recycling
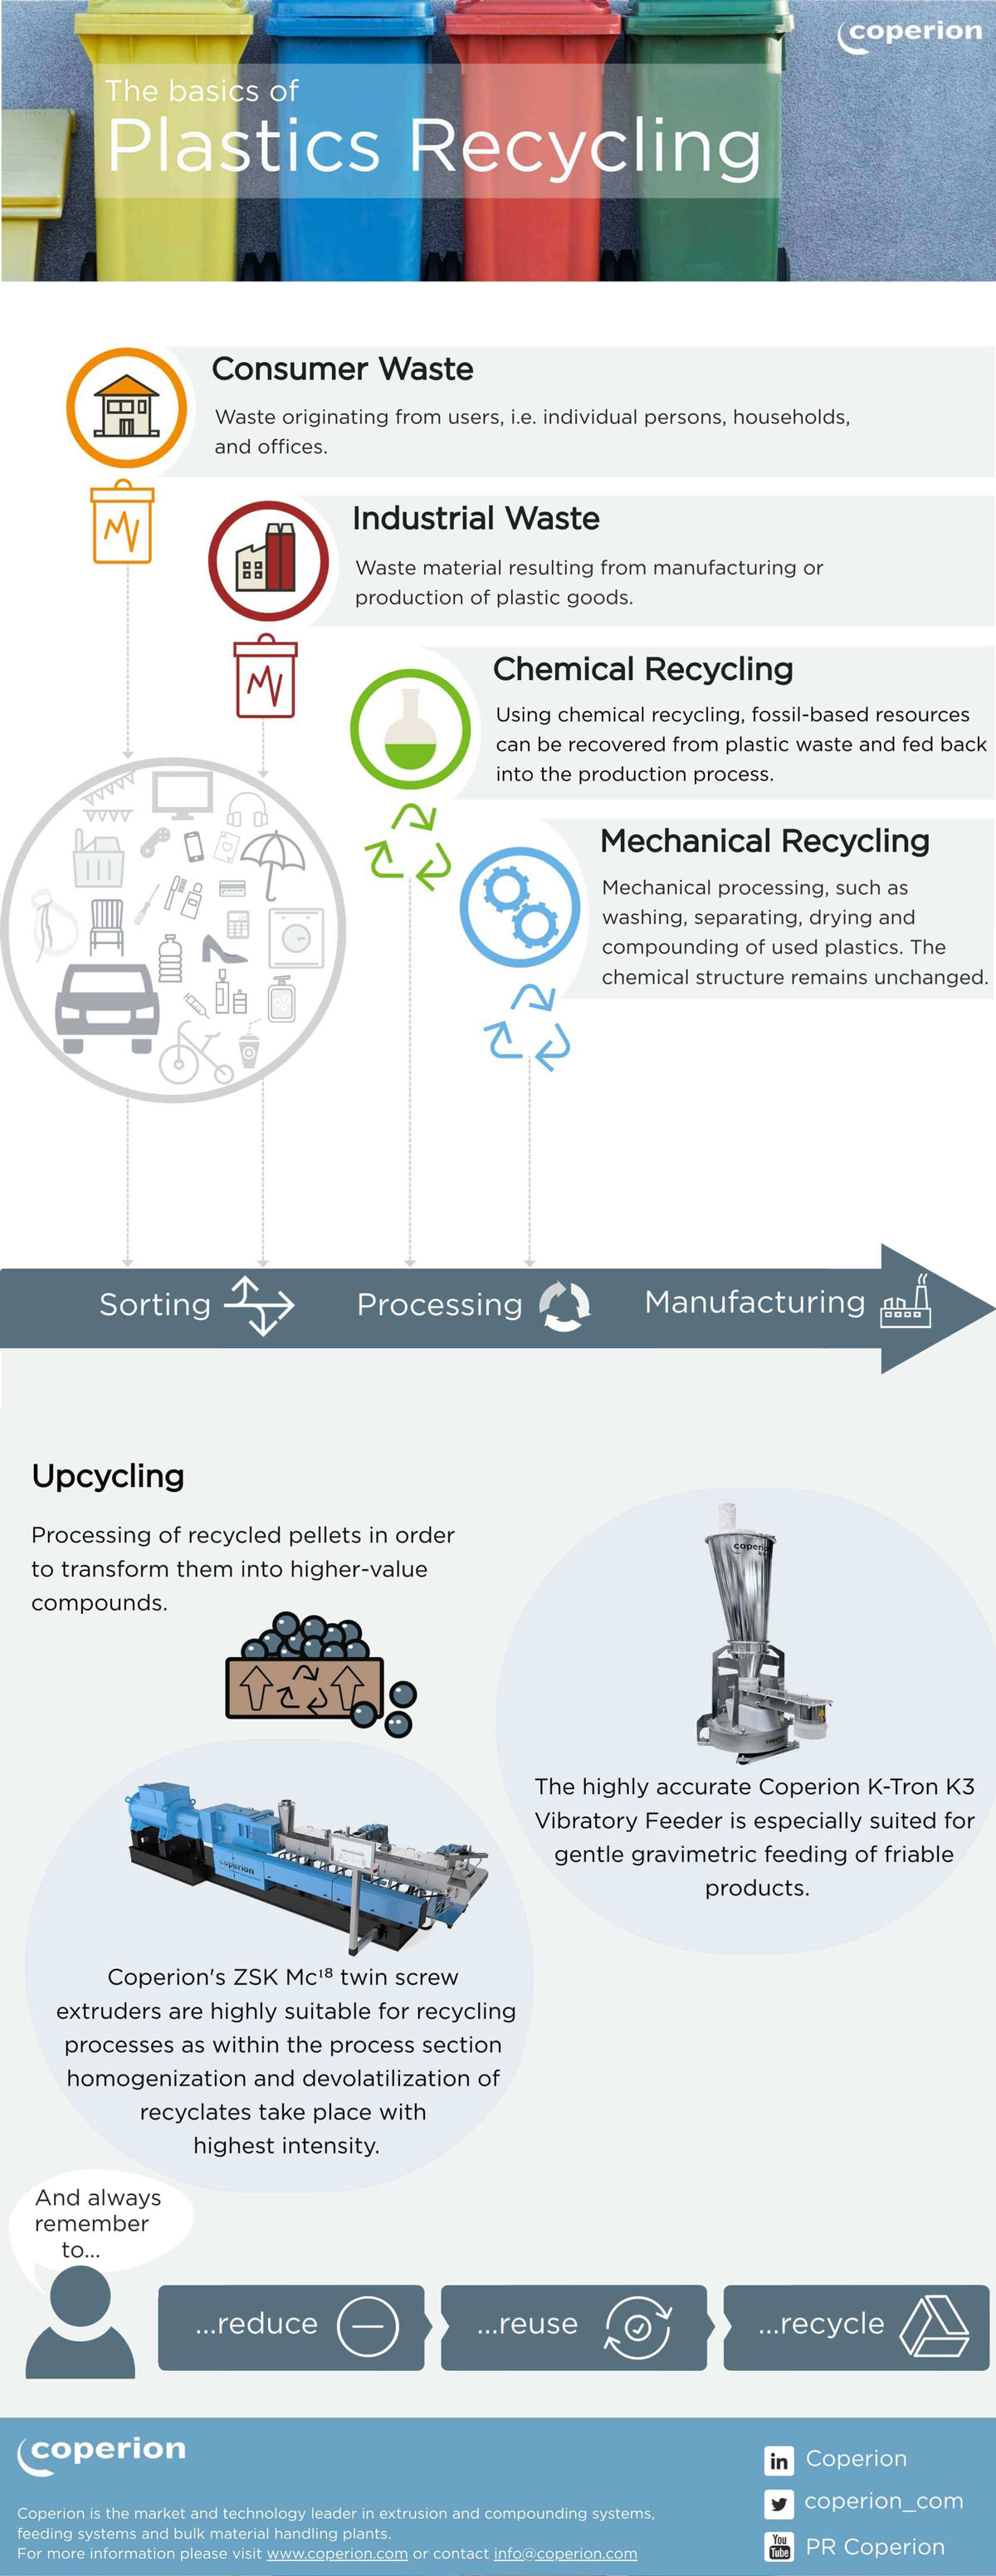
Image Source: coperion.com
Plastic is a durable material often found in modern electronics from cell phones to monitors and laptops to printers. While plastic recycling is largely a myth — if not treated as a subset of a comprehensive recycling solution — it’s important to understand what it contains.
62. Make recycling a part of life
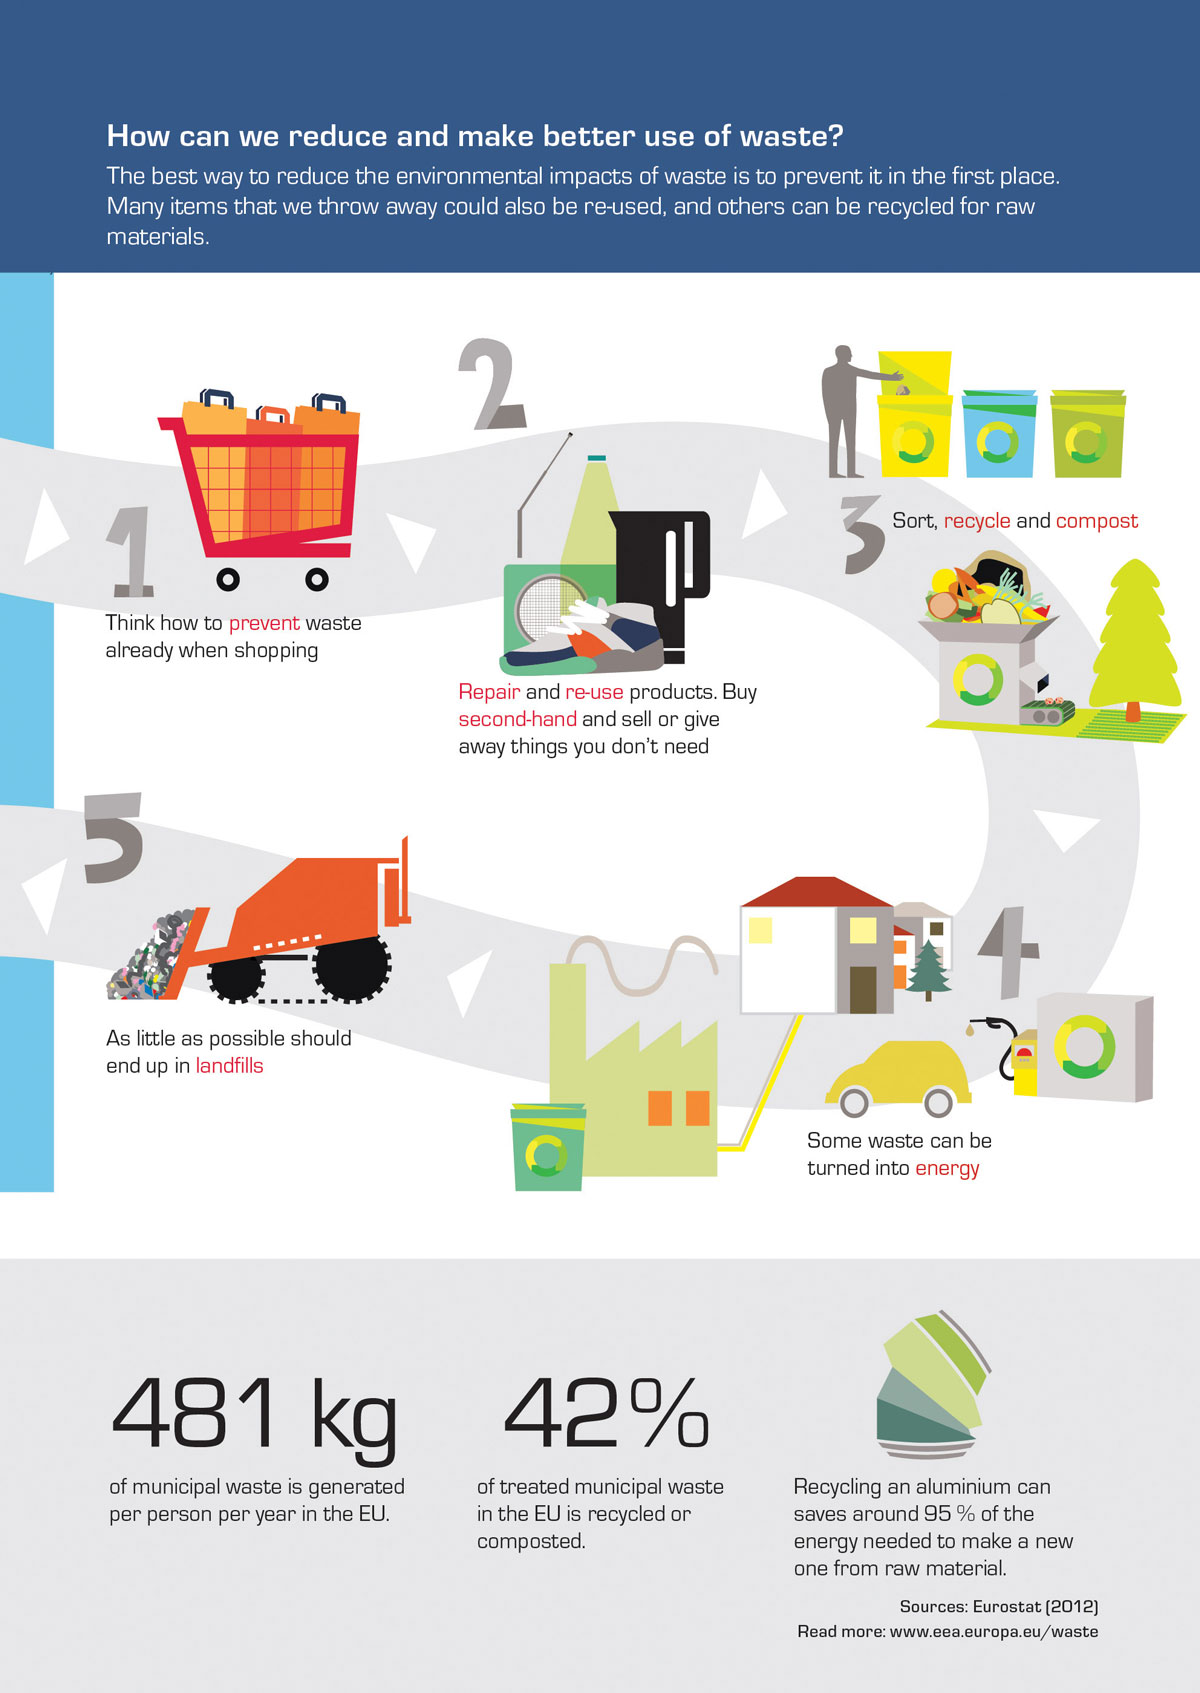
Image Source: eea.europa.eu
The best way to reduce waste is to prevent its generation. By being more mindful of how we use products, what we buy and consume, and whether we reuse any of the things we buy, we can live more impactful lives.
63. Baby steps to recycling
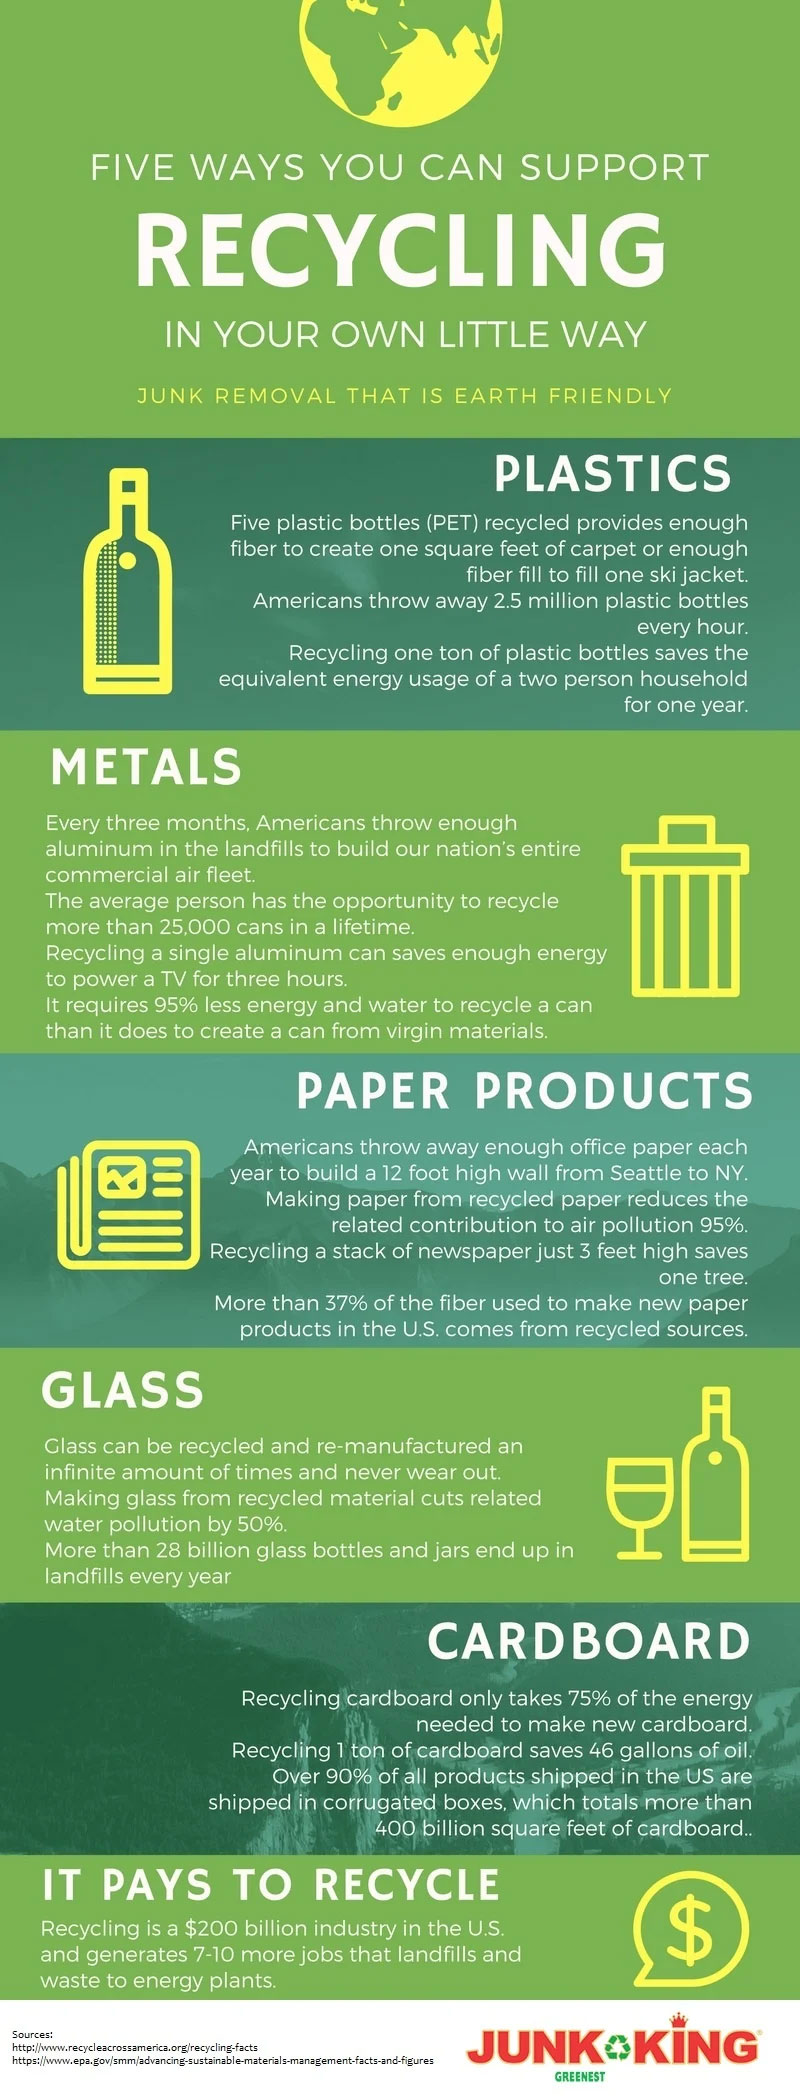
Image Source: info.junk-king.com
Not sure where to start recycling? Start with PET bottles that Americans throw 2.5 million of every hour.
64. Think before you shop

Image Source: epa.gov
The EPA (Environmental Protection Agency) wants you to think carefully when you step out or go online to shop. Consider whether you truly need it, how much of it you require, and whether the product and business are eco-friendly.
65. Recycle properly

Image Source: rumpke.com
While it’s essential to recycle, doing it properly is more important. Learn what that means in these 3 easy steps.
66. Ethical e-waste recycling

Image Source: hummingbirdinternational.net
In an ideal world, recycling is always sustainable. Since we don’t live in an ideal world, conditions must be introduced in all e-waste recycling practices that are grounded in sustainability. That’s called ethical e-waste recycling.
67. A quick recycling guide

Image Source: junkluggers.com
Don’t let all the symbols and colors confuse you. Bookmark this recycling guide and visit it every time you’re about to sort out the trash.
68. What to recycle
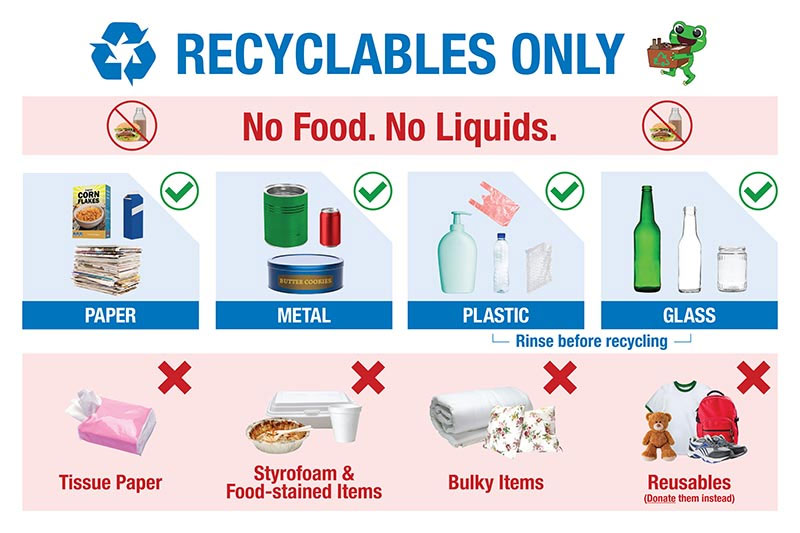
Image Source: towardszerowaste.gov.sg
If you are unsure about what to recycle and what needs to go in the bin, the infographic below helps clarify.
69. A recycling guide by the EPA
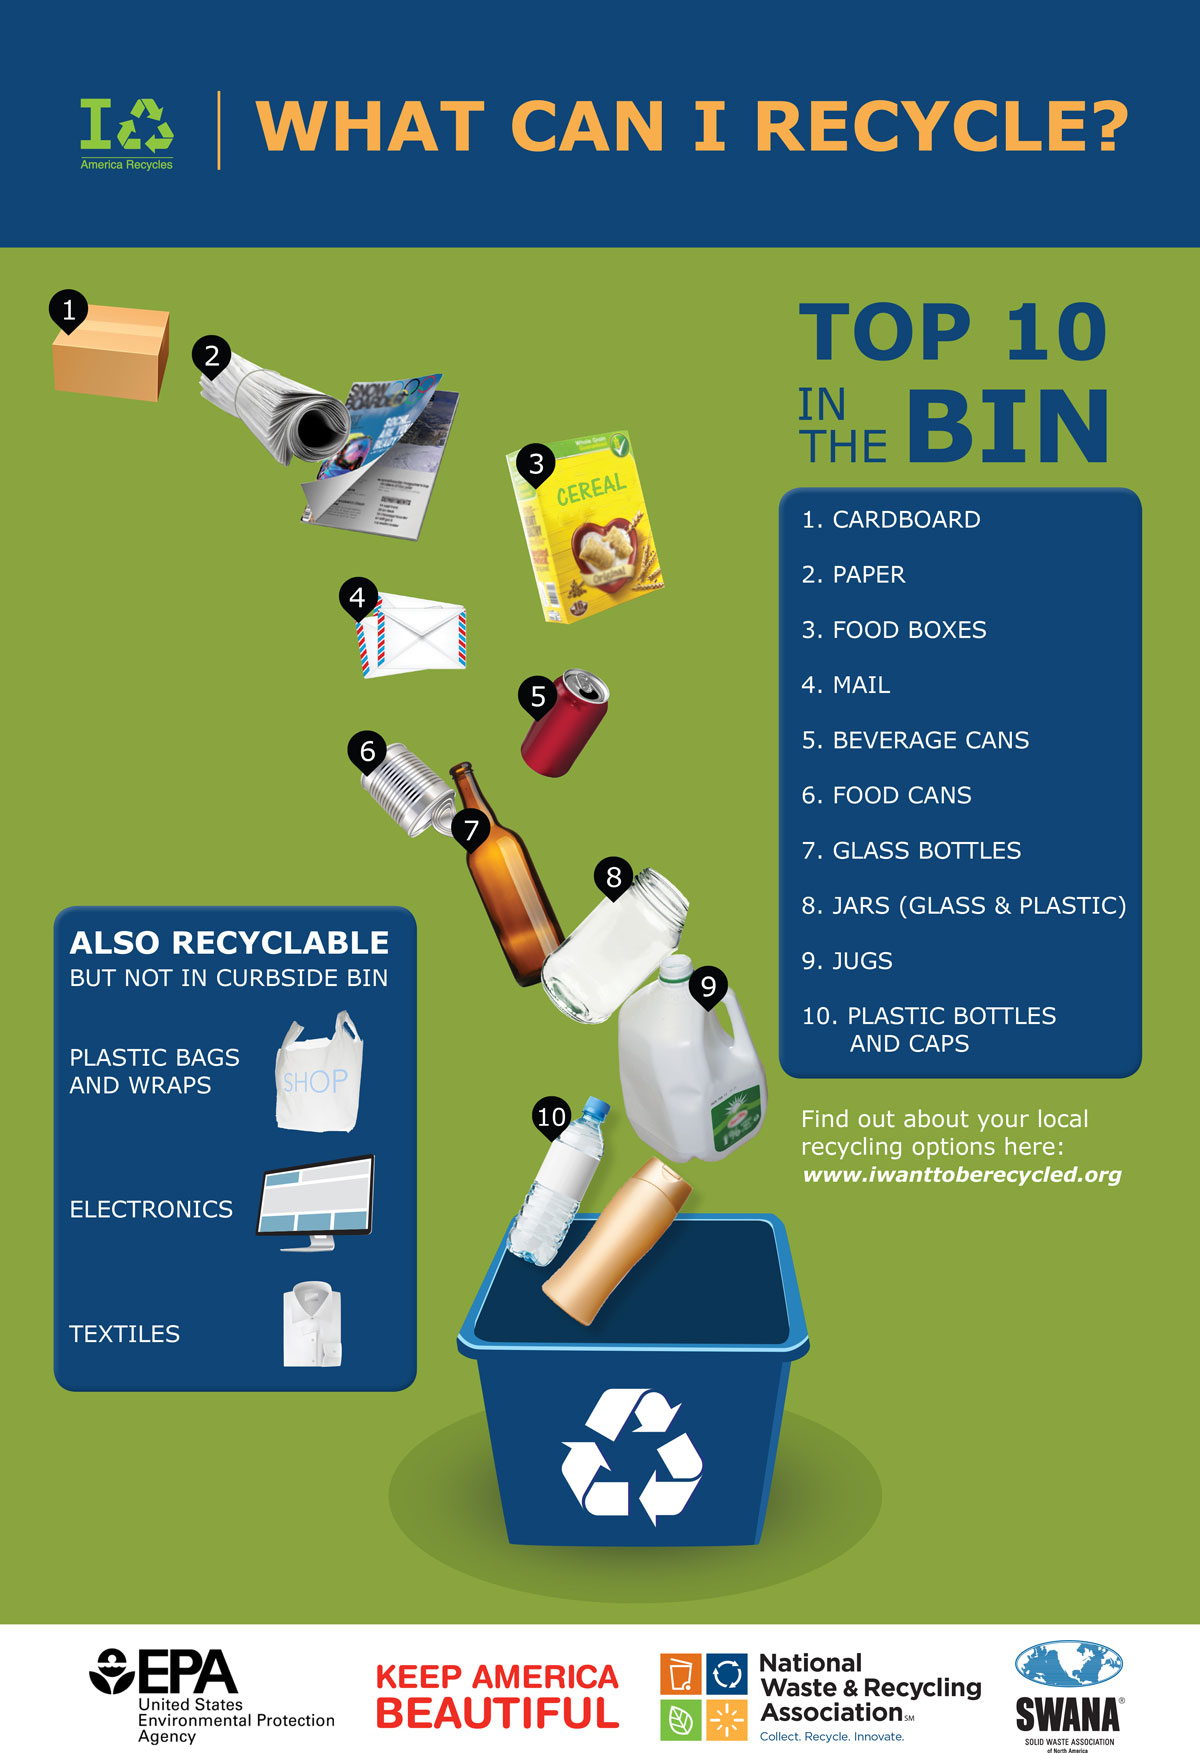
Image Source: epa.gov
Include your children in the recycling frenzy! Use this simple guide from EPA to teach and learn about the top 10 recyclable items.
70. Consumers get recycling-ready
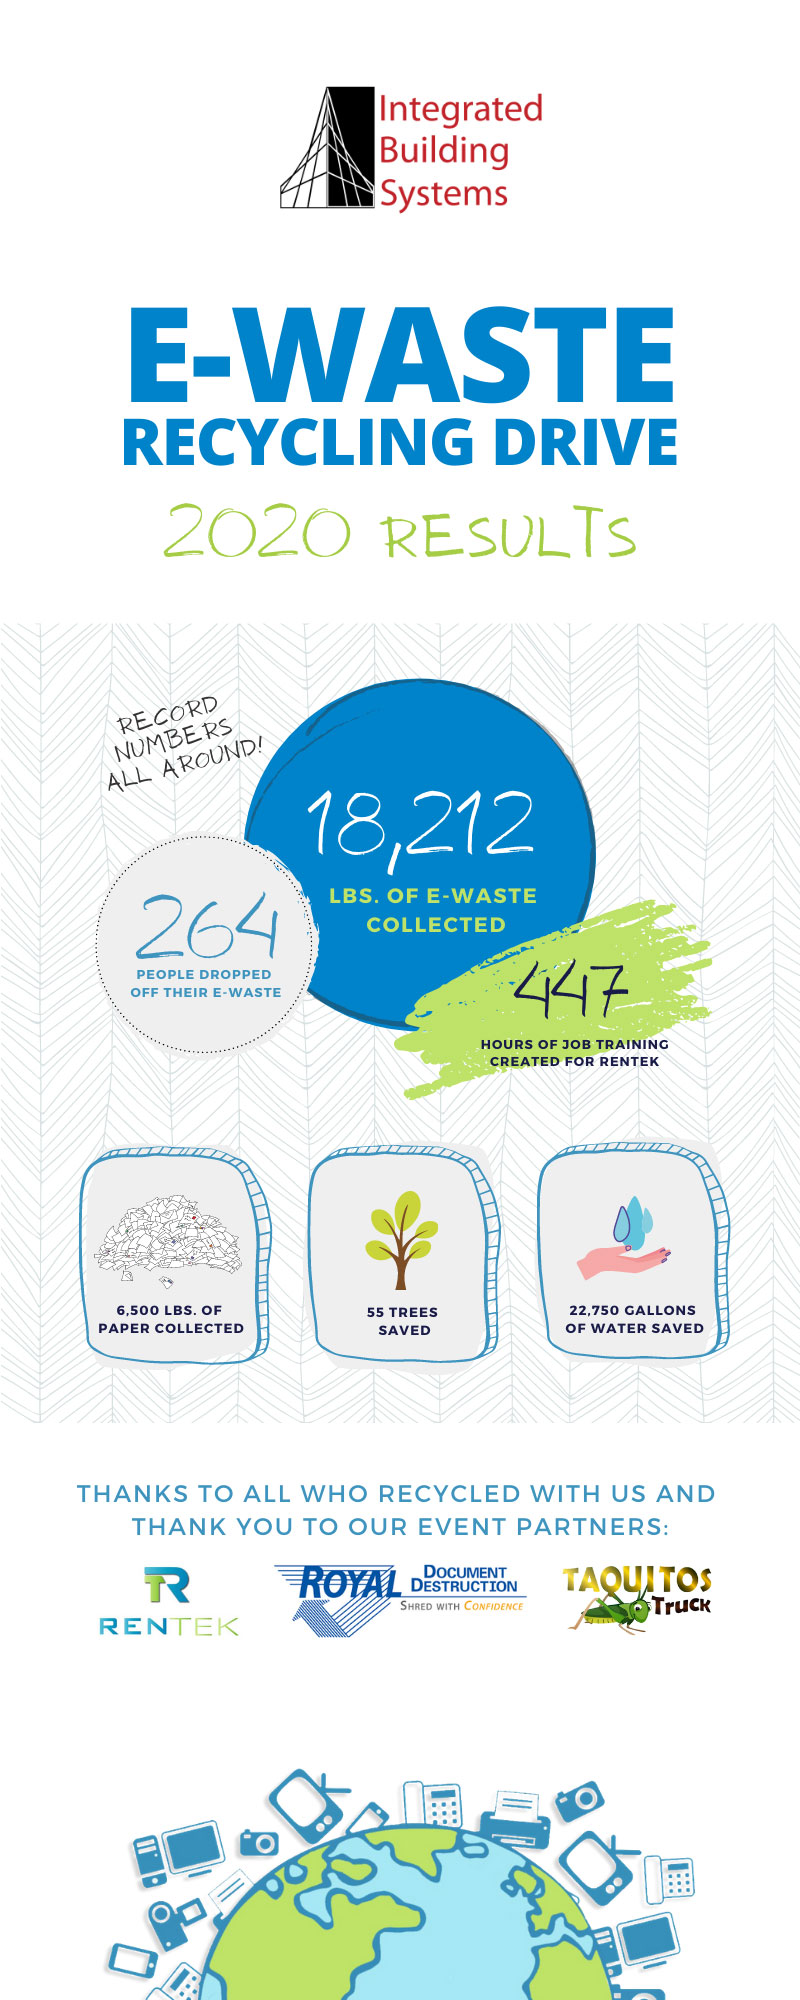
Image Source: ibswebsite.com
More and more people are getting interested in living a greener life. Recycling numbers are booming, as one local IT firm in Columbus, OH, discovered during its annual recycling drive.
71. More people are recycling than before

Image Source: blog.livinggreentechnology.org
A tire company sent out a survey to its consumers in 20 markets across the U.S. The responses showed an encouraging trend of recycling becoming more mainstream. Take a look.
72. Cellphone recycling rates
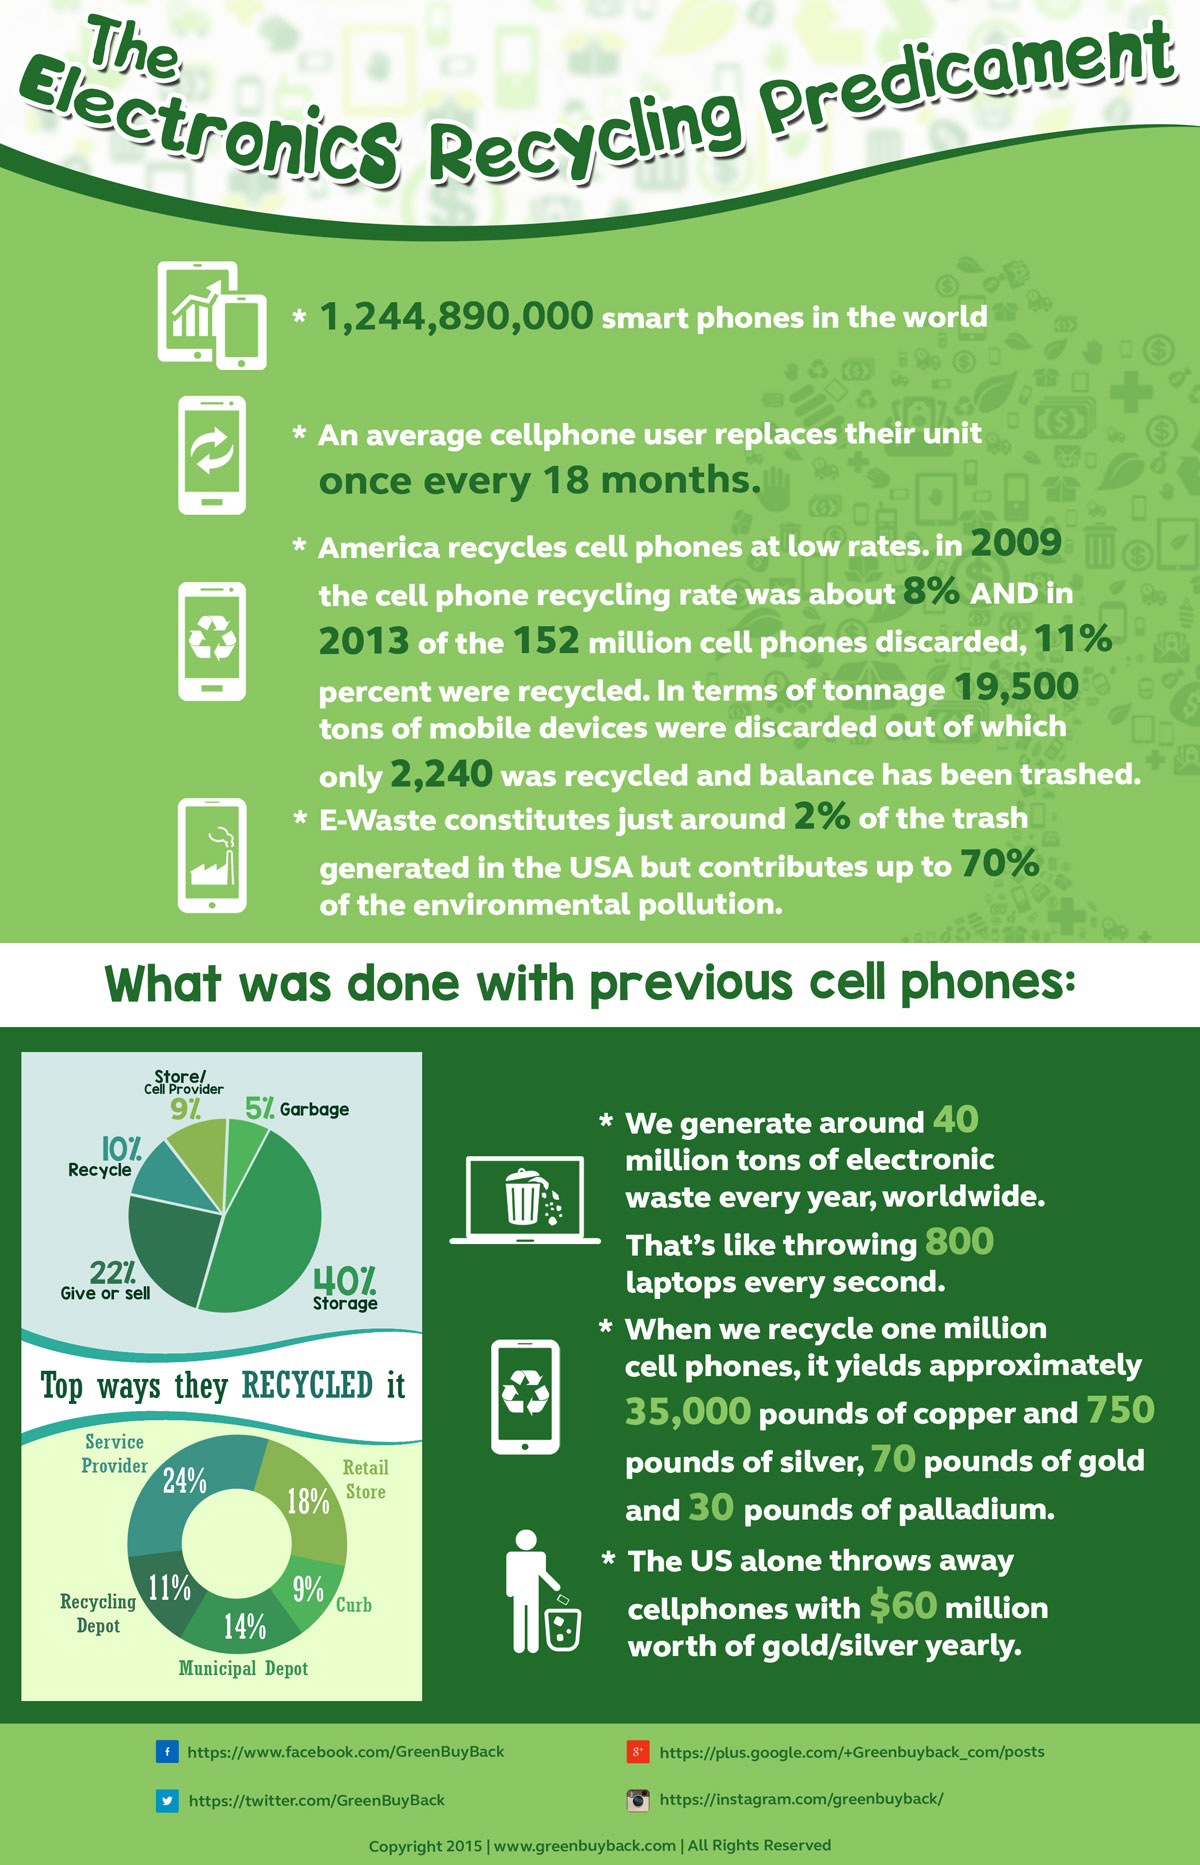
Image Source: blogs.rochester.edu
A typical user replaces their smartphone every 18 months or so. In many cases, software upgrades necessitate that; in others, consumeristic marketing can be held responsible. Find out other staggering facts surrounding global cellphone usage.
73. Aligning learning objects with IT purchases for schools
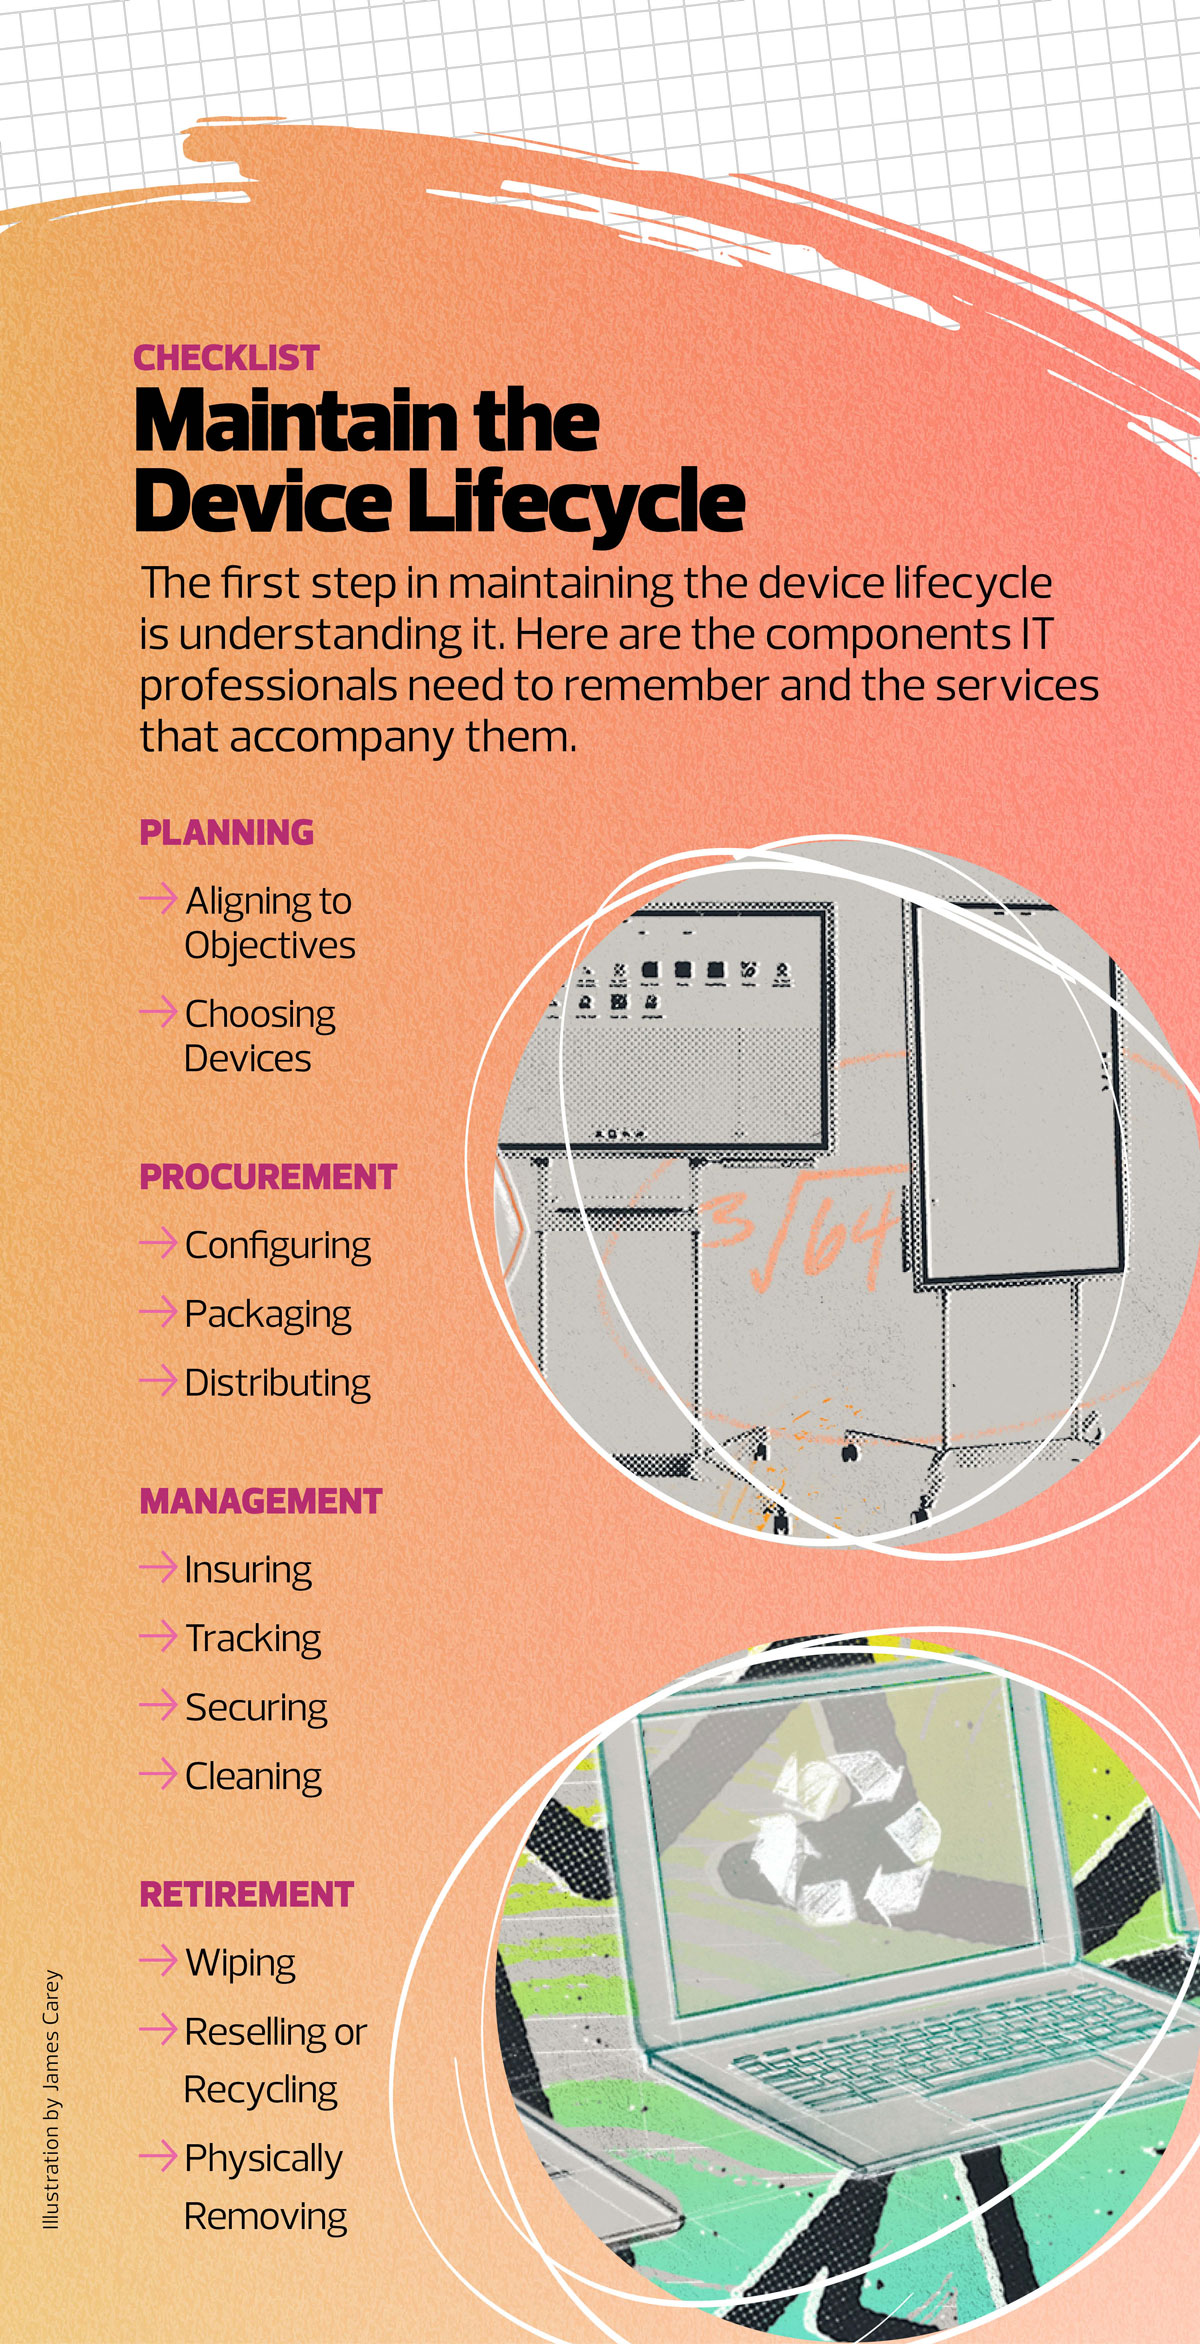
Image Source: edtechmagazine.com
An educational tech firm shares the infographic below as a checklist for IT professionals and schools to consult when buying new devices and gadgets for school.
74. Eco-friendly classrooms
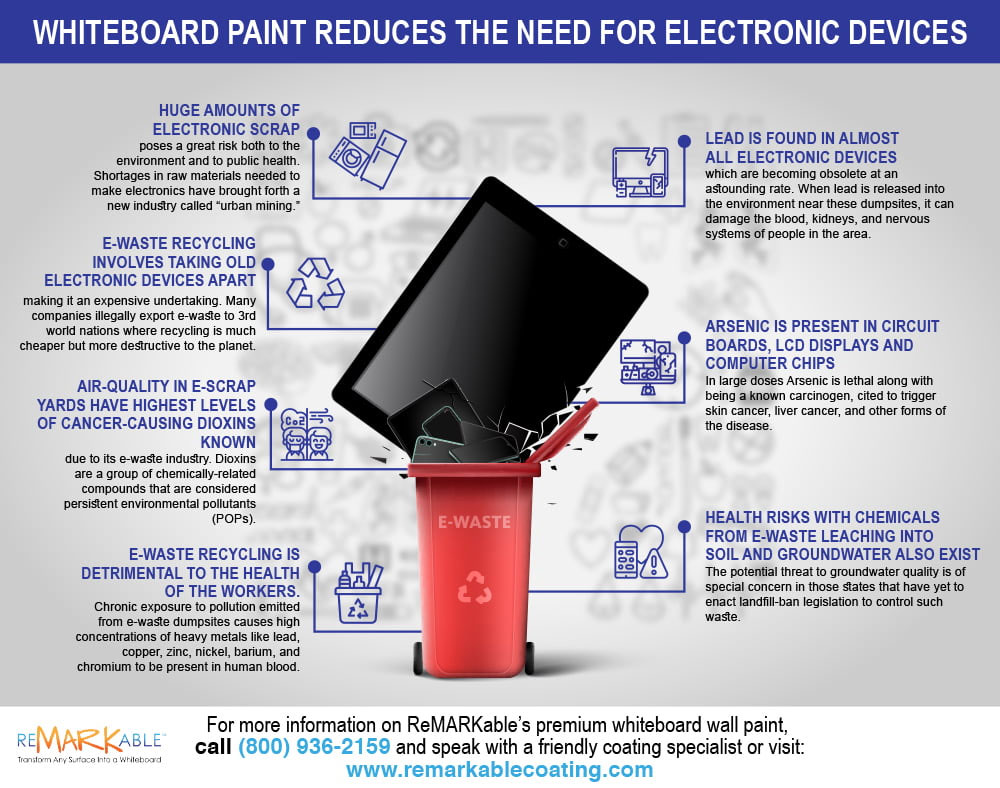
Image Source: remarkablecoating.com
If your school has installed energy-efficient lights in the classroom but continues to rely on digital devices for routine classwork, that’s not very efficient. This business believes whiteboards are an alternative that can potentially reduce this reliance in some cases.
75. E-waste in education
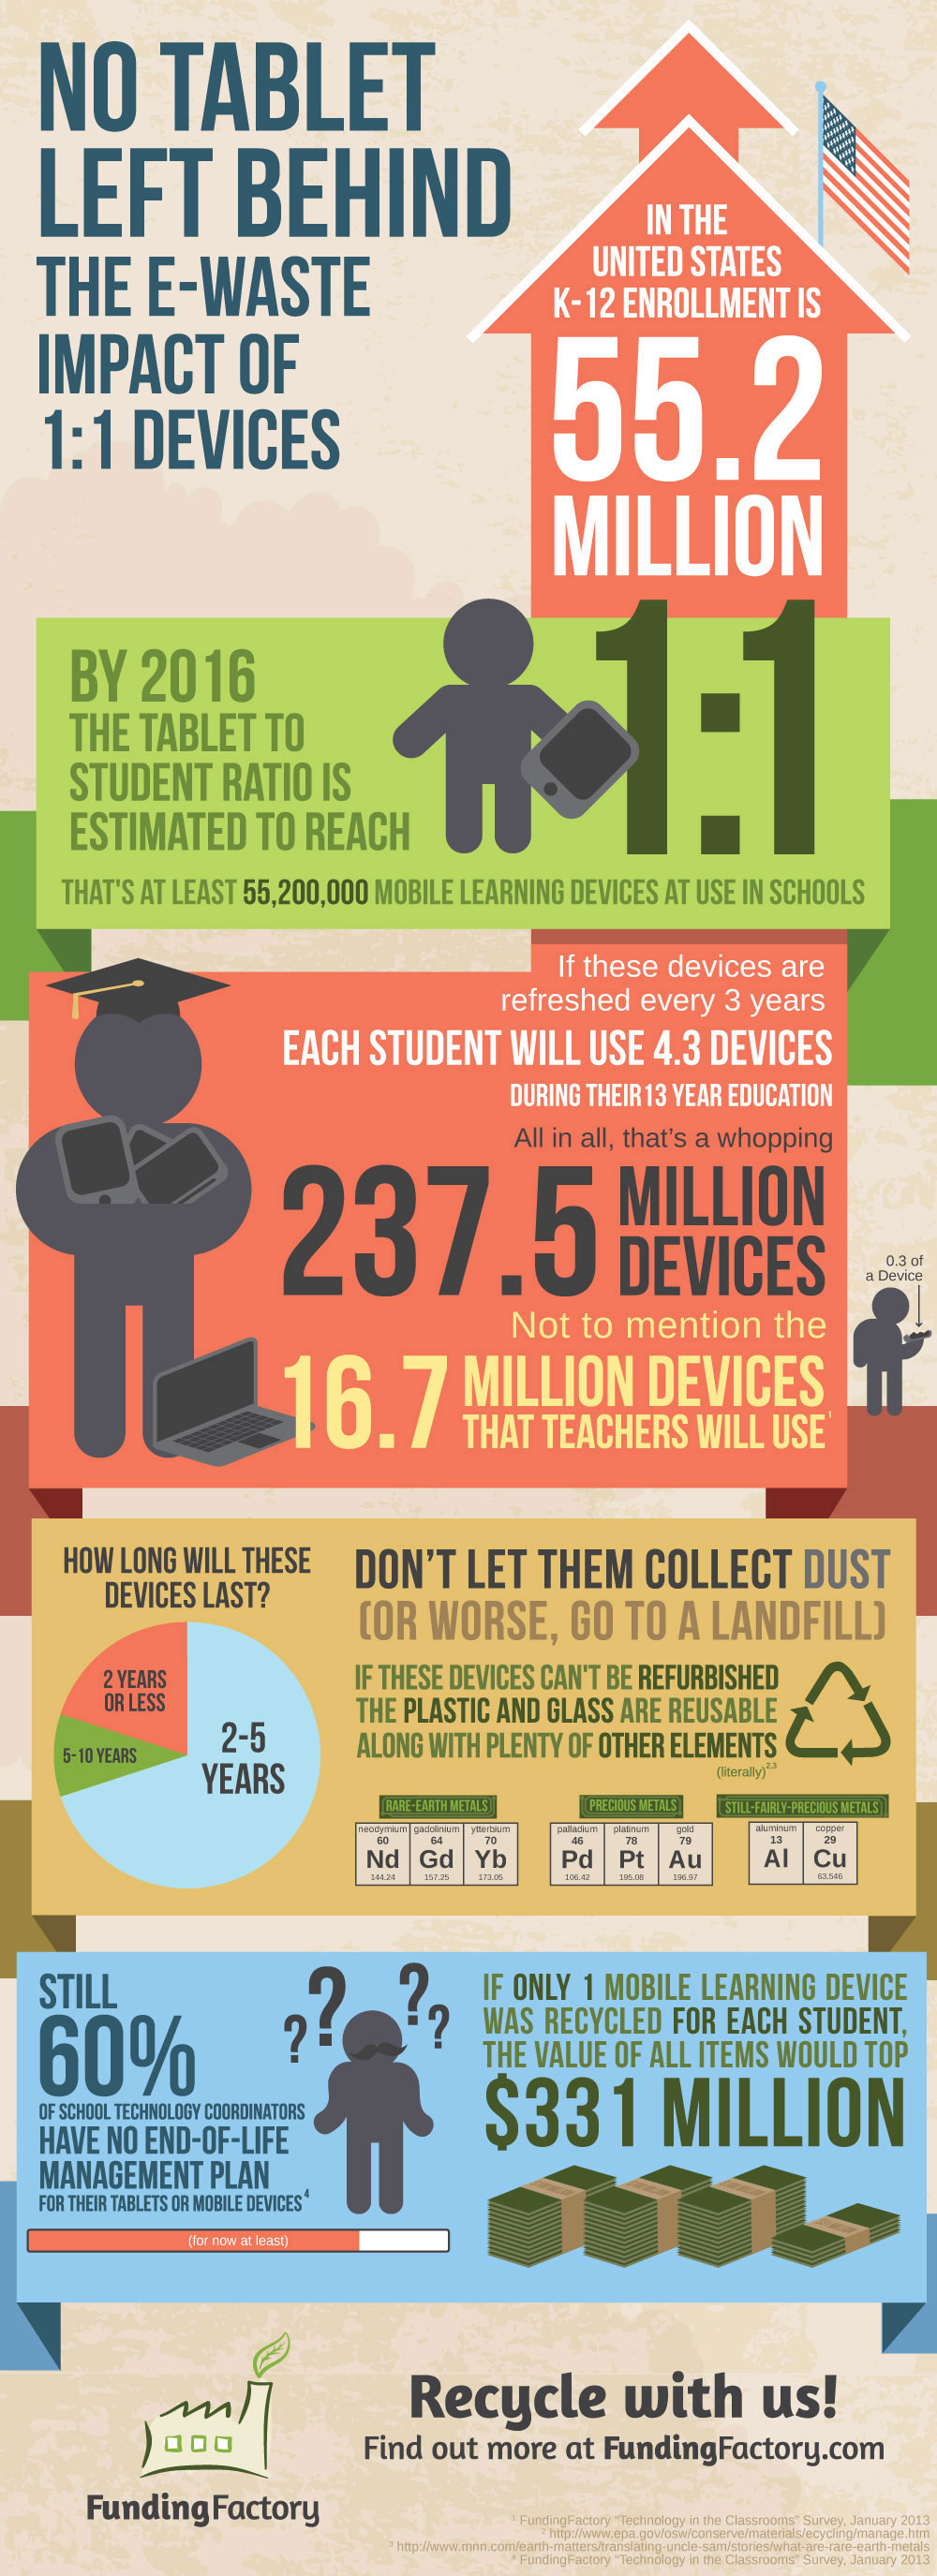
Image Source: hummingbirdinternational.net
Our schools and universities have become more digital, at a tremendous environmental cost. This infographic from 2016 takes you back to the recent history to show you how it started.
76. Recycling in schools

Image Source: resources.pepsicorecyclerally.com
Teachers and school administrators are in a unique position to instill the habit and love of recycling in children from a young age. By encouraging discipline in recycling, we can build generations of eco-conscious citizens.
77. History of Recycling
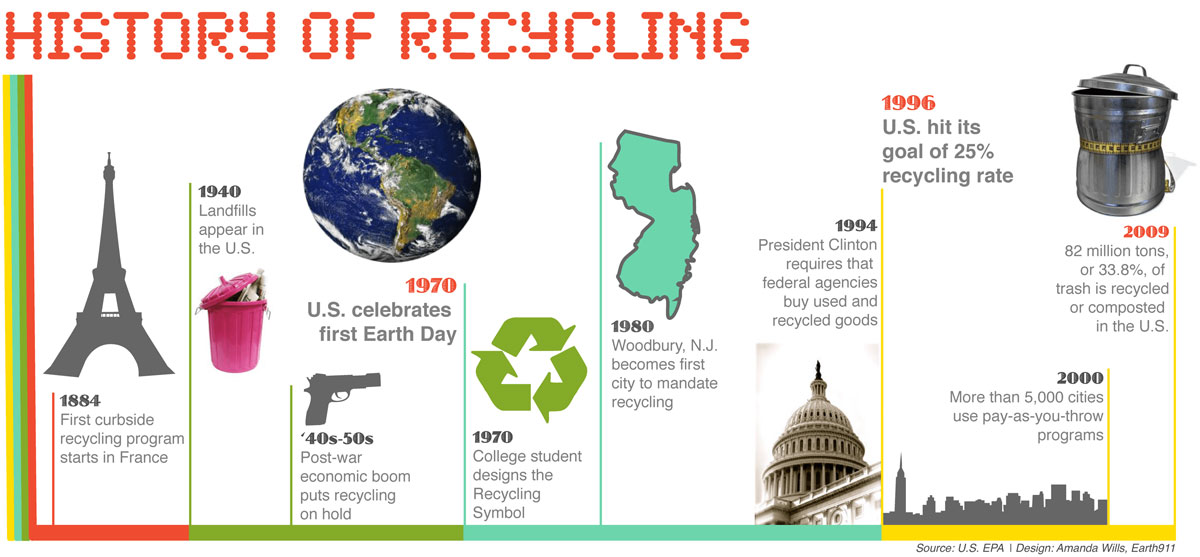
Image Source: allgreenrecycling.com
When you think about how little people know about recycling and its merits, you’d think it’s a new concept. The truth is that the first curbside recycling program started in France back in 1884. Ready for more startling facts? Check out the infographic below.
78. Importance of proper e-waste recycling

Image Source: inhabitat.com
There’s e-waste recycling, and then there’s proper and responsible e-waste recycling. Learn the difference with this helpful graphic.
79. Recycling in Iowa, US
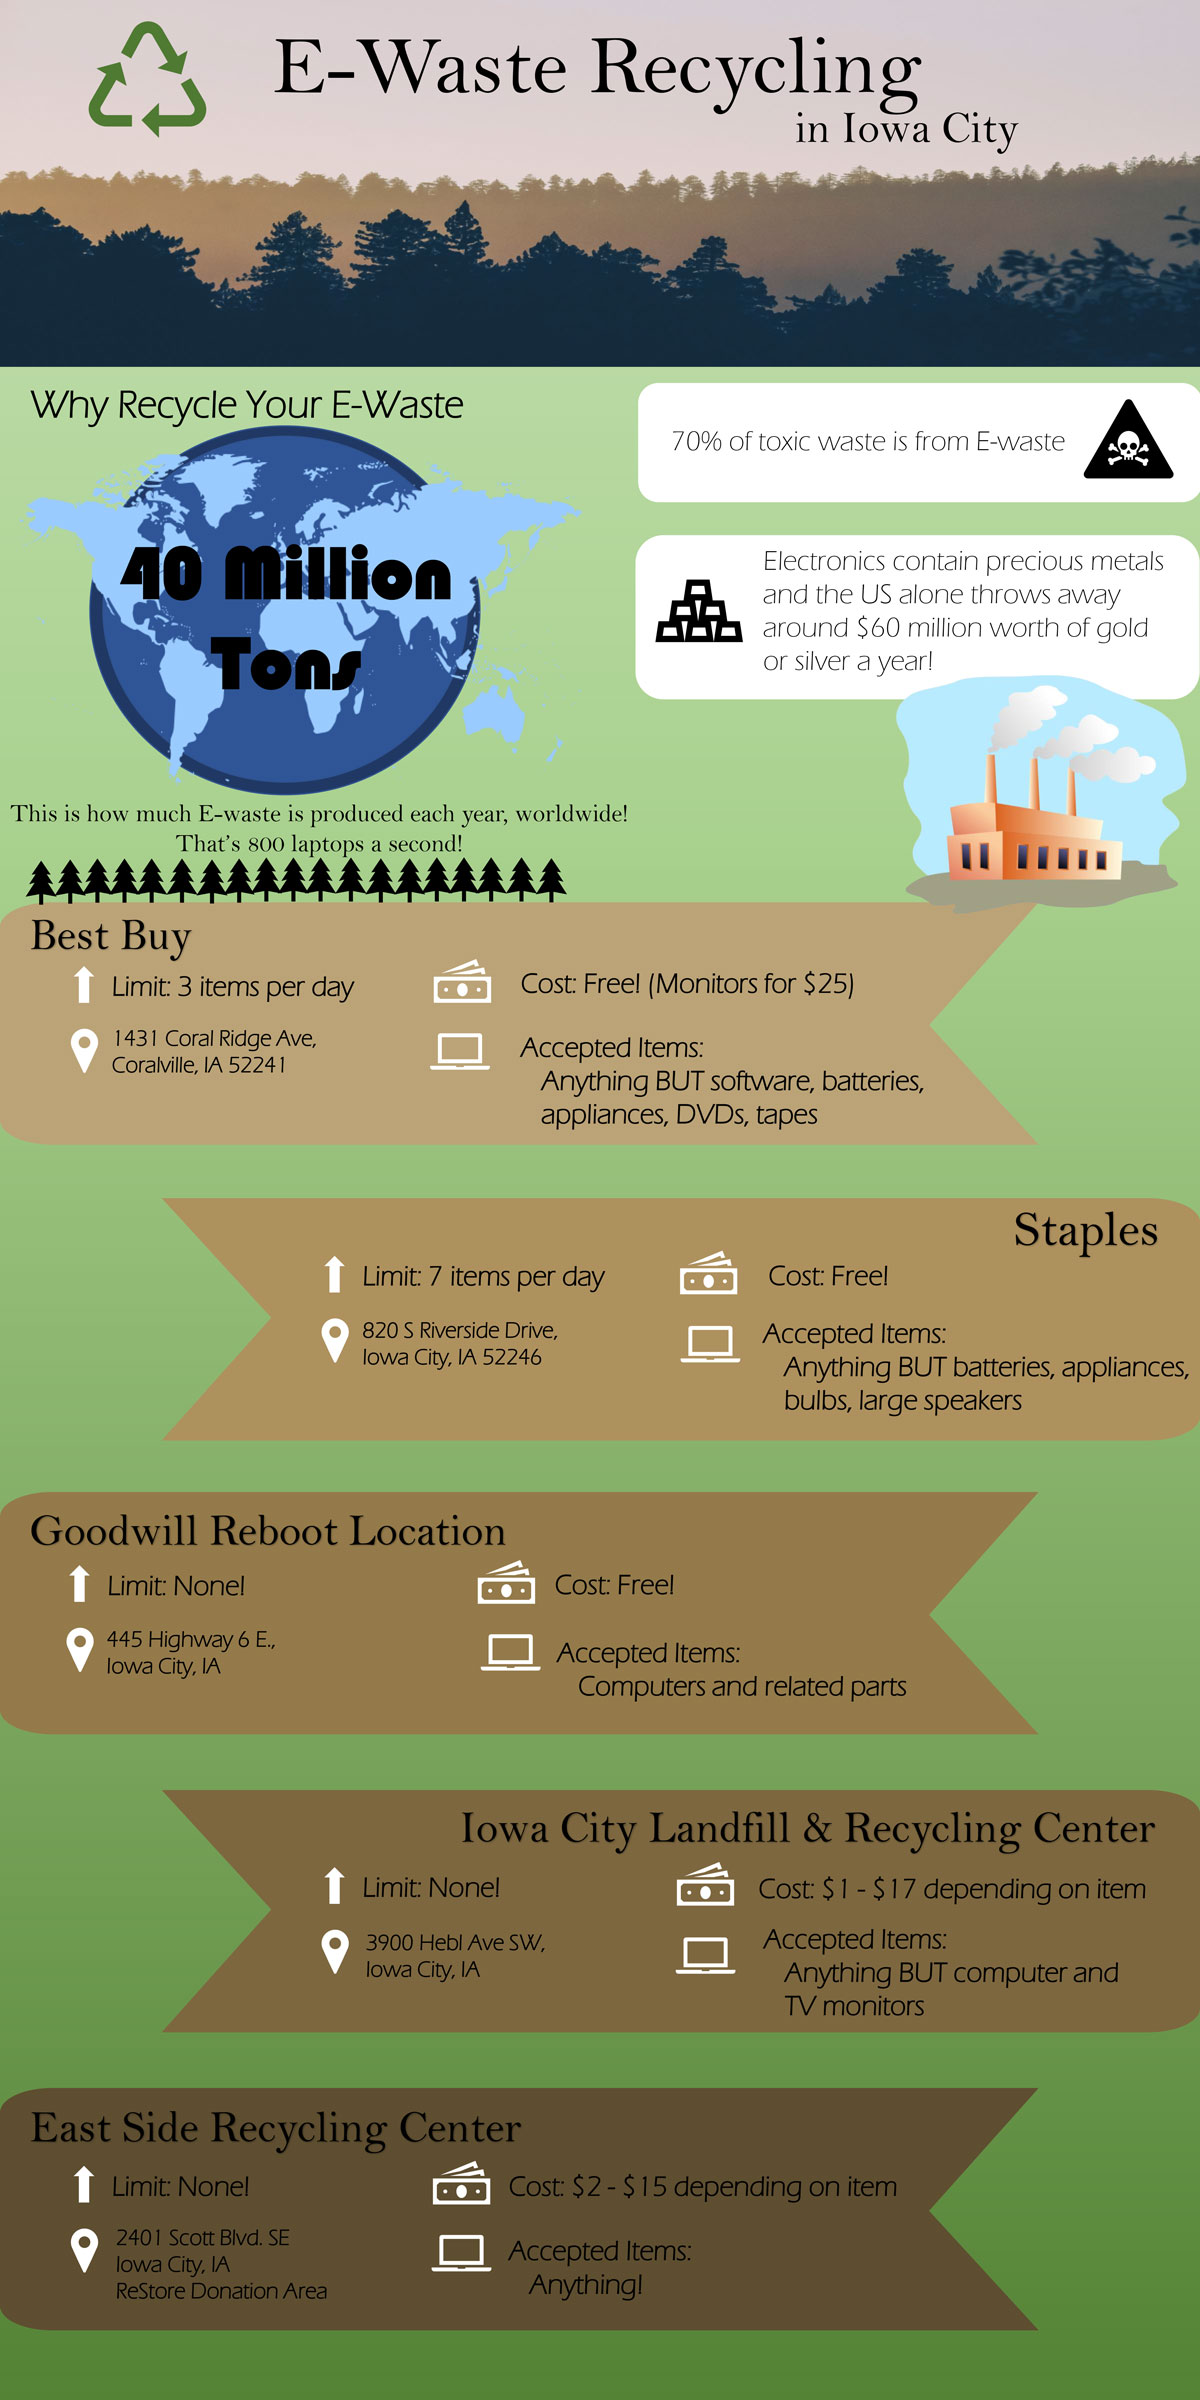
Image Source: sustainability.uiowa.edu
This is a helpful resource for people in Iowa City looking for a handy guide to learn where to drop off their old electronics.
80. Data protection while donating old tech
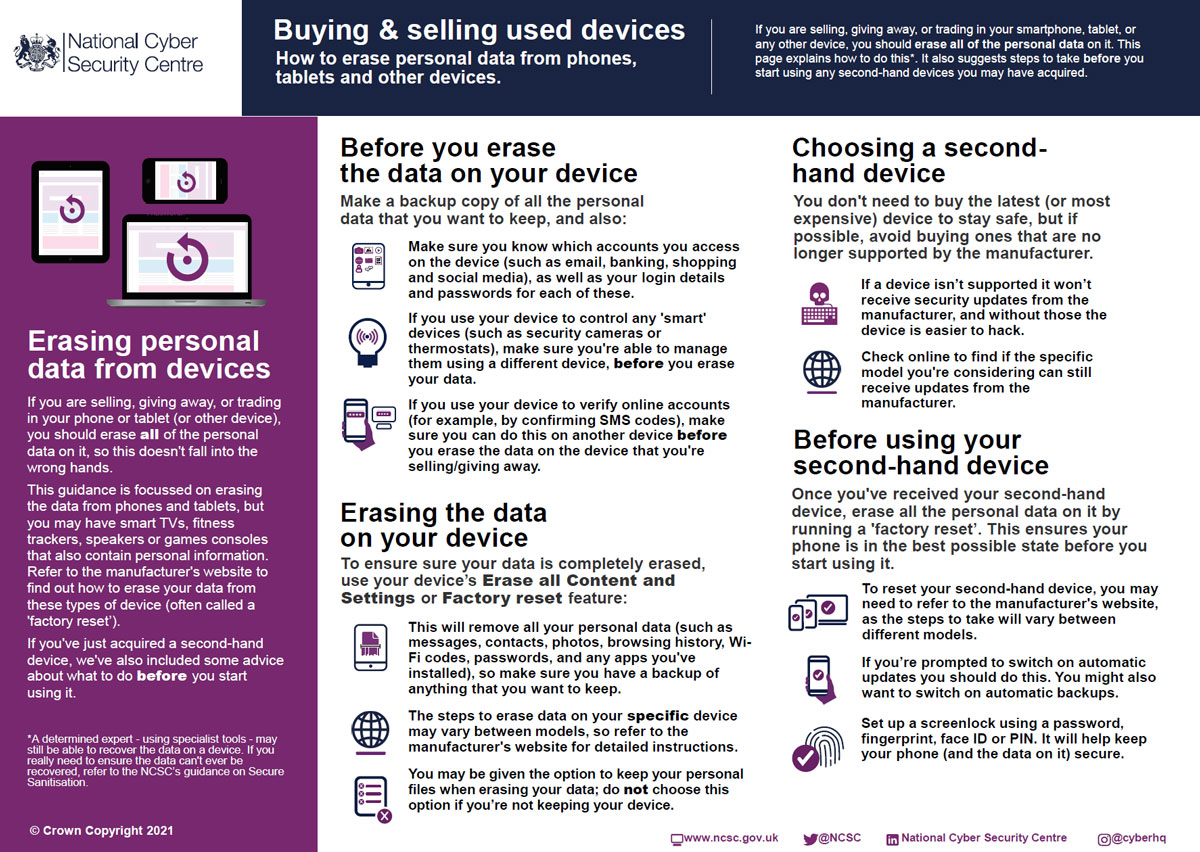
Image Source: ncsc.gov.uk
Improper e-waste recycling gives rise to cybersecurity concerns. You must erase all the data from your devices through professional data destruction methods before donating or recycling.
81. Recycling waste and saving gorillas? Sign me up!
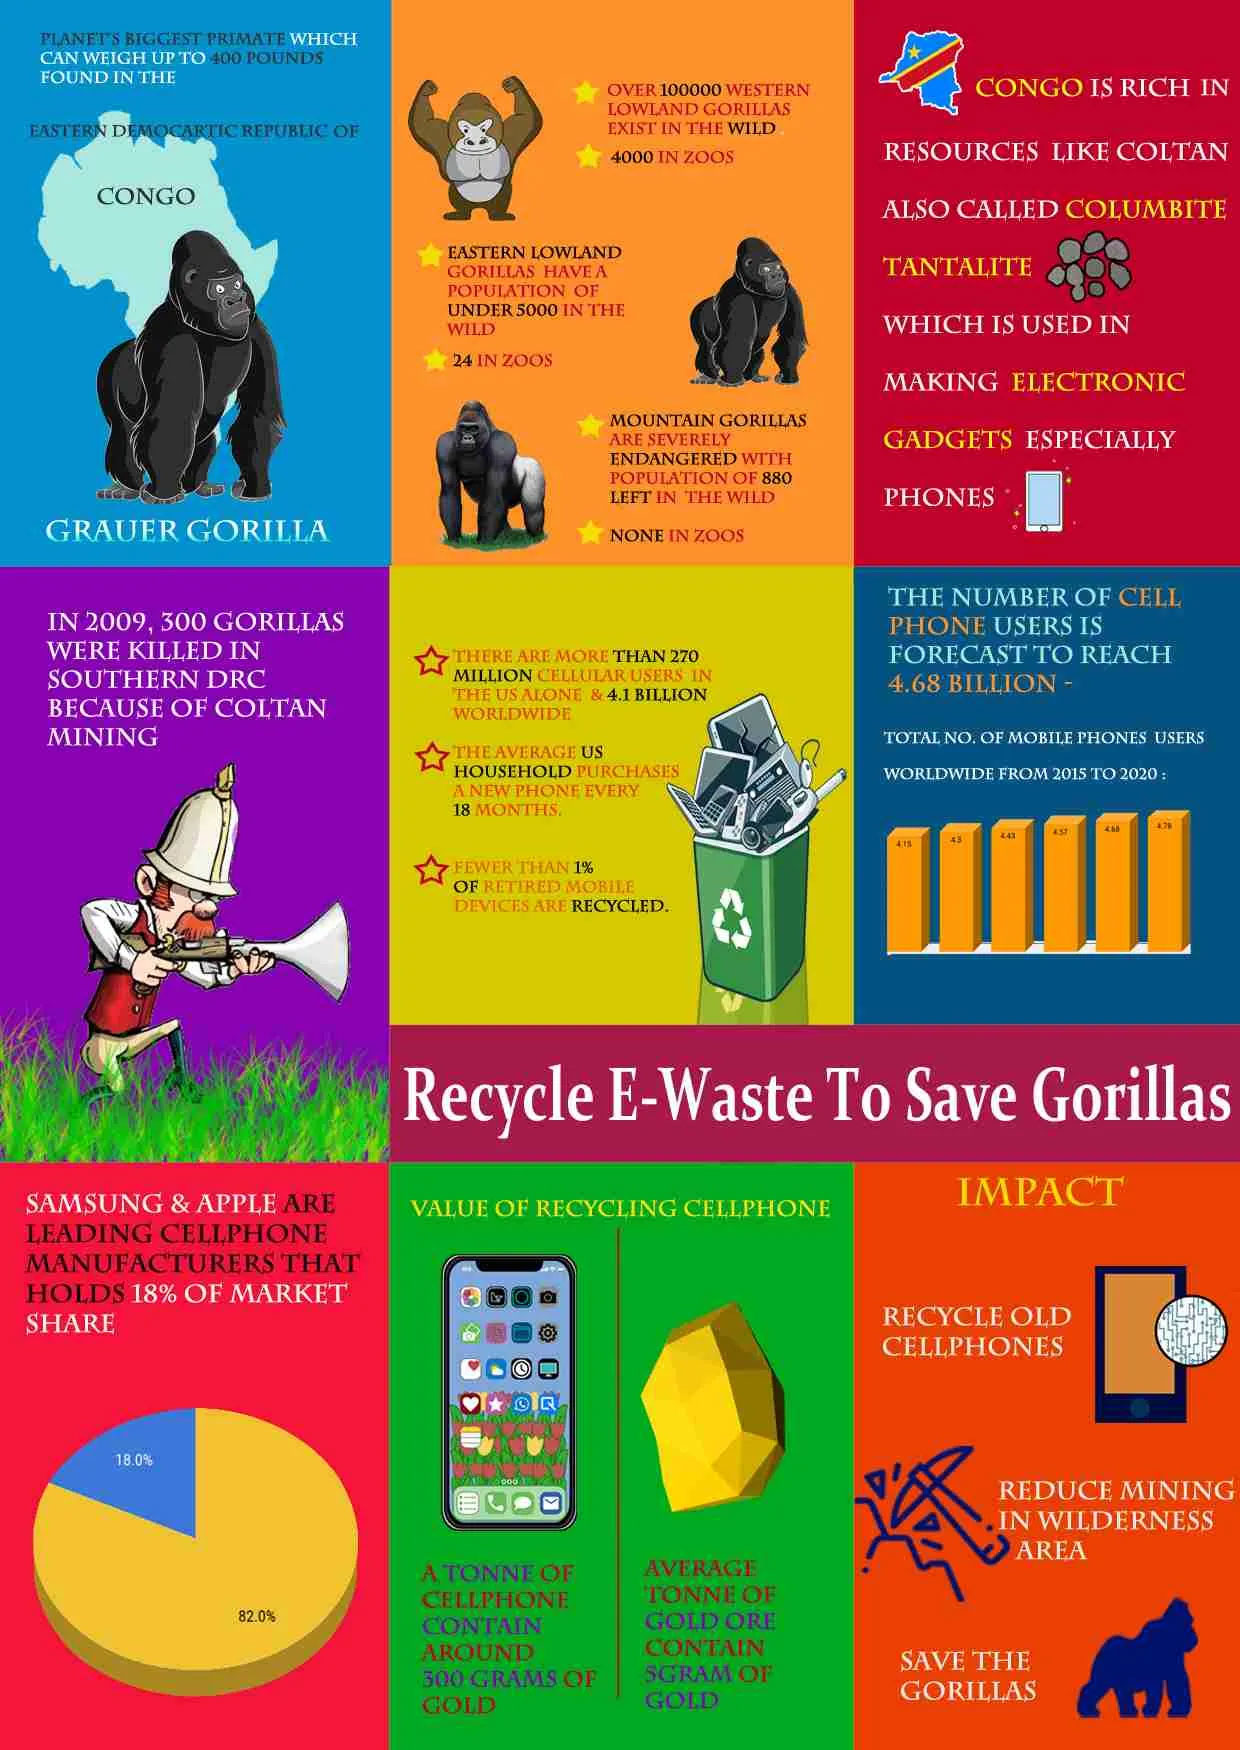
Image Source: thebossmagazine.com
Who knew you could recycle waste and use it to save gorillas in Congo? Let’s do it.
82. Cost-efficient pathway to a green business

Image Source: psprint.com
Contrary to popular belief, recycling and living a more conscientious life is not that expensive. Here are 5 affordable ways to turn a leaf and make your business green.
83. Green business ideas

Image Source: neutrinobursts.com
If you are striving to live an entrepreneurial life, why not start a green business? Take a look below to see if any ideas sound cool.
84. Consumer Goods Forum on Sustainable Business Success
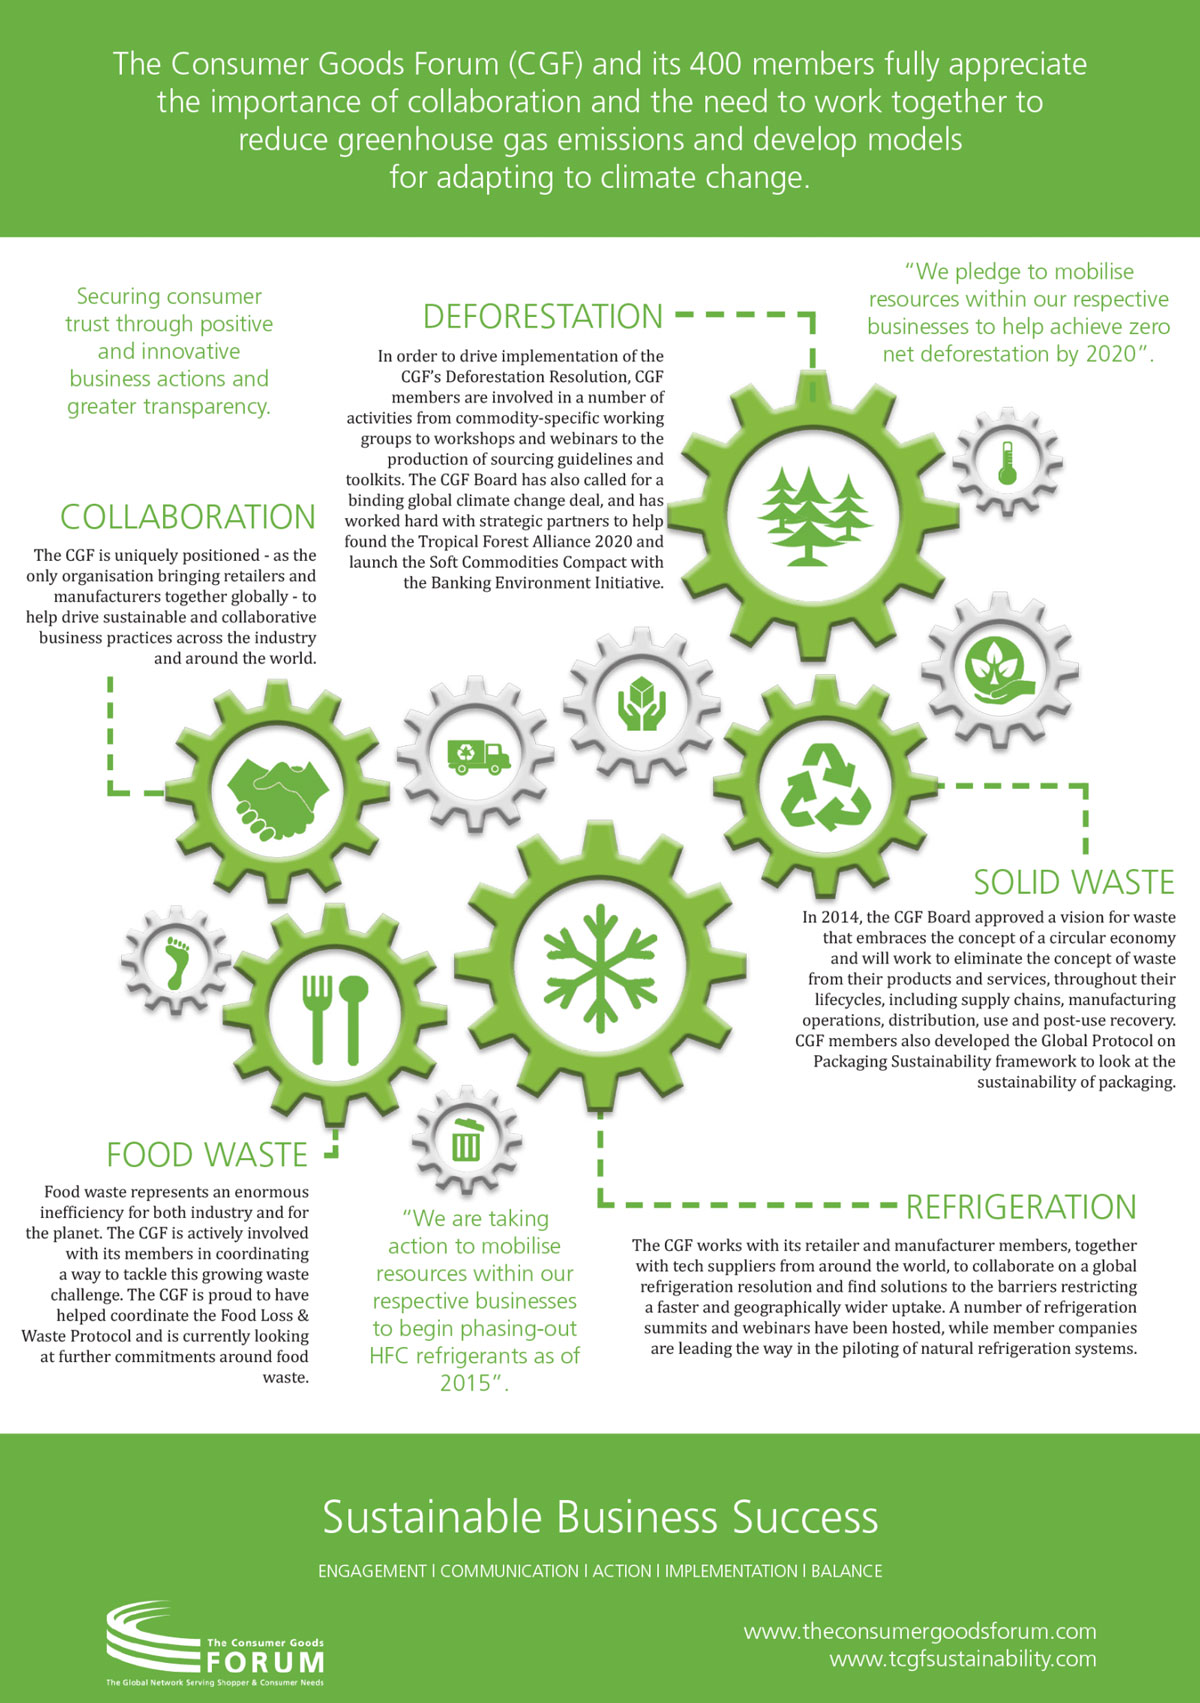
Image Source: theconsumergoodsforum.com
The CGF, a global organization helping businesses become more sustainable, shares in this infographic how it facilitates success for sustainable businesses.
85. Turning waste into energy
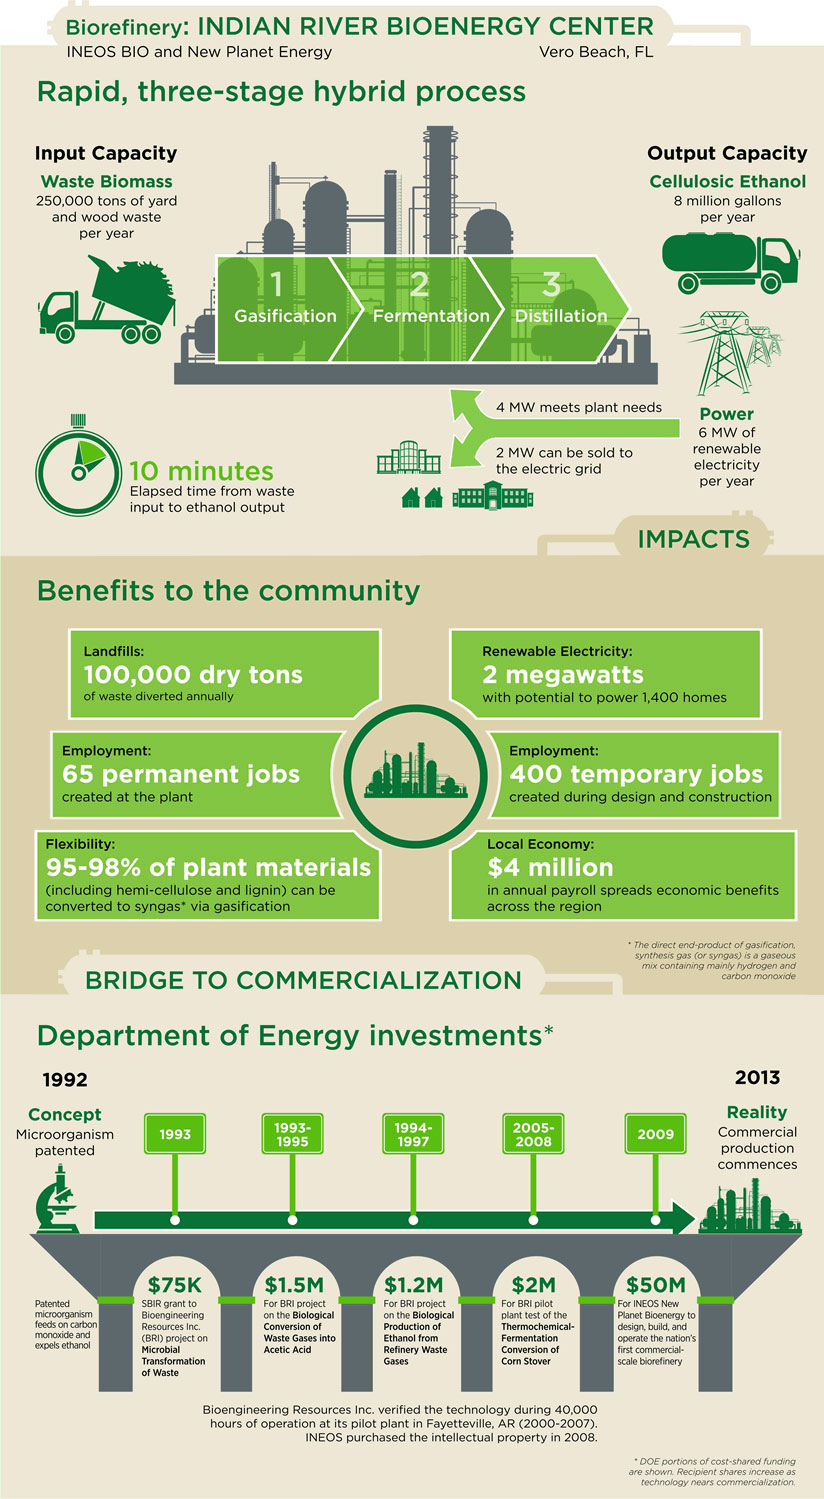
Image Source: energy.gov
Several ways exist to turn waste into beneficial things for use. In this case, energy and power. The infographic below shows how one plant in Vero Beach, FL takes waste from landfills and turns it into energy that powers homes and businesses.
86. How is waste turned into energy

Image Source: energy.gov
The last infographic piqued your interest? Take a look at this one to learn the process behind the practice.
87. The Green Economy
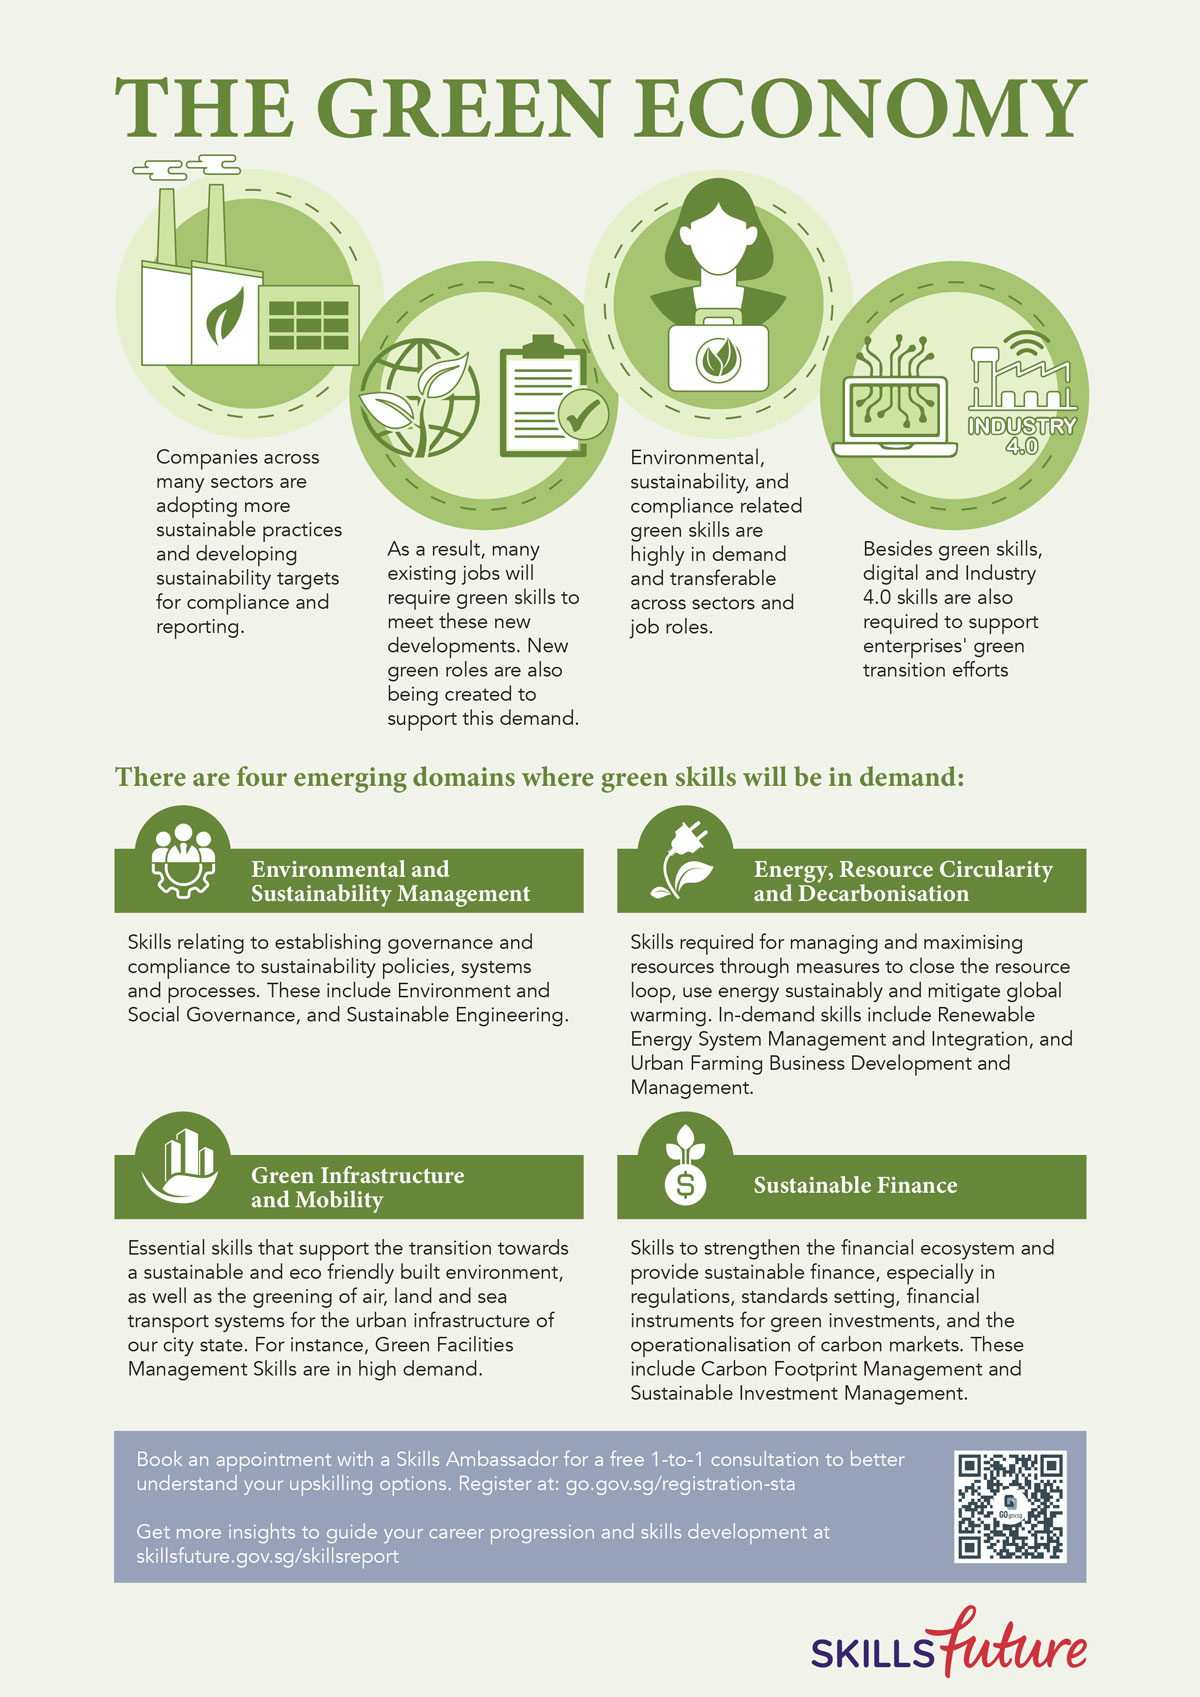
Image Source: skillsfuture.gov.sg
As companies around the world become more environmentally minded, sectors within the economy are emerging, creating a need for expert people in green skills.
88. What is a circular economy?
The circular economy aims to reduce the pressure on natural resources by keeping them in use for as long as possible. Check out the infographic below to understand how it works.
89. Tips to reduce, reuse, and recycle

Image Source: bestdisposalinc.com
Adopt a green living lifestyle with these helpful tips to reduce, reuse, and recycle your trash.
90. Invite the kids to join in
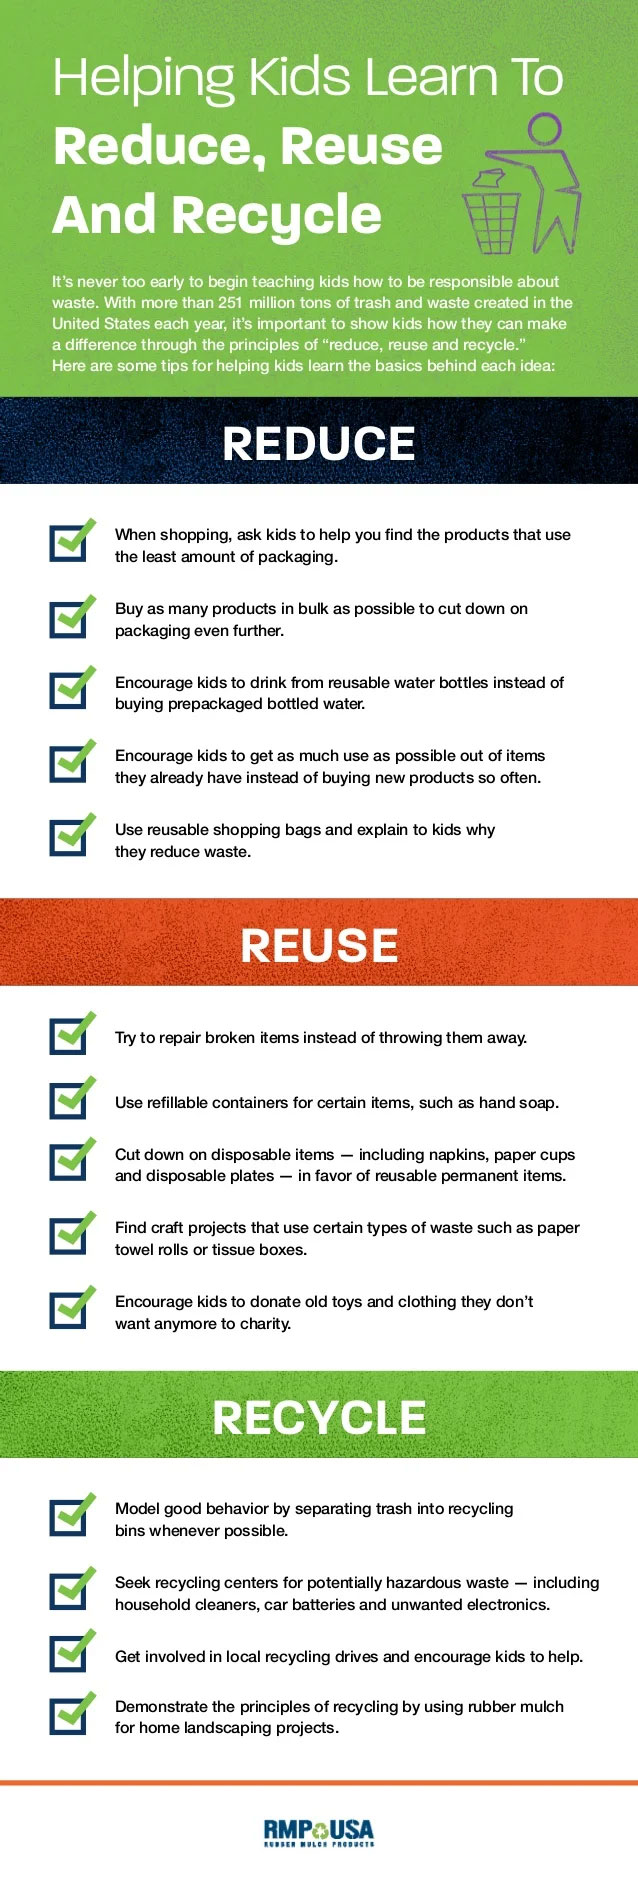
Image Source: juicygreenmom.ca
Make recycling a family affair. Use the infographic below to talk to children about the importance of recycling and how to do it easily and efficiently.
91. Top 20 things to recycle

Image Source: ecogreenlove.com
As you become more comfortable with your recycling journey, add some more items to your list of recyclables. Let this infographic help.
92. Key benefits of recycling
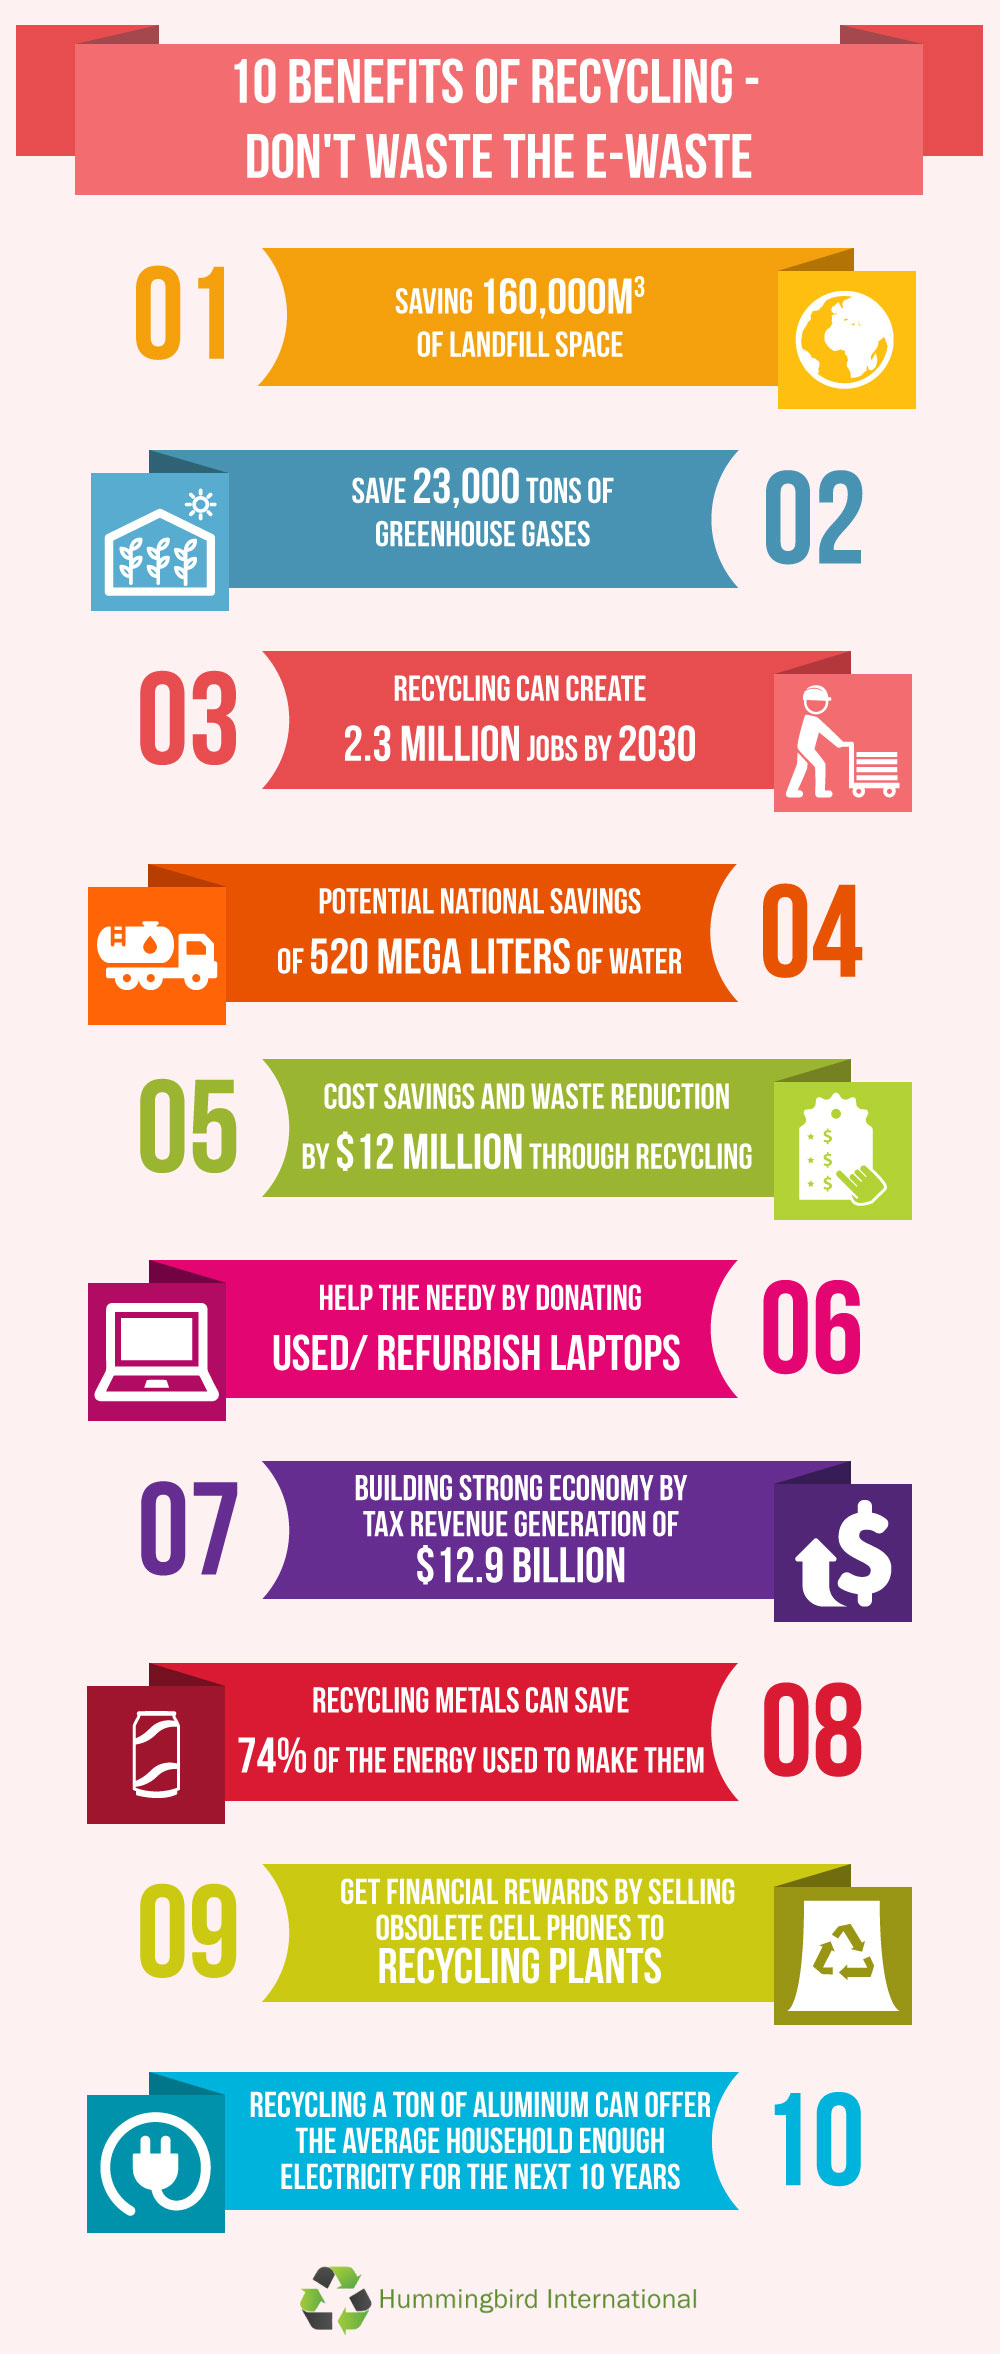
Image Source: hummingbirdinternational.net
What good does waste recycling do to the people and planet? Here are the top 10 benefits we enjoy when we recycle.
93. Reducing your carbon footprint
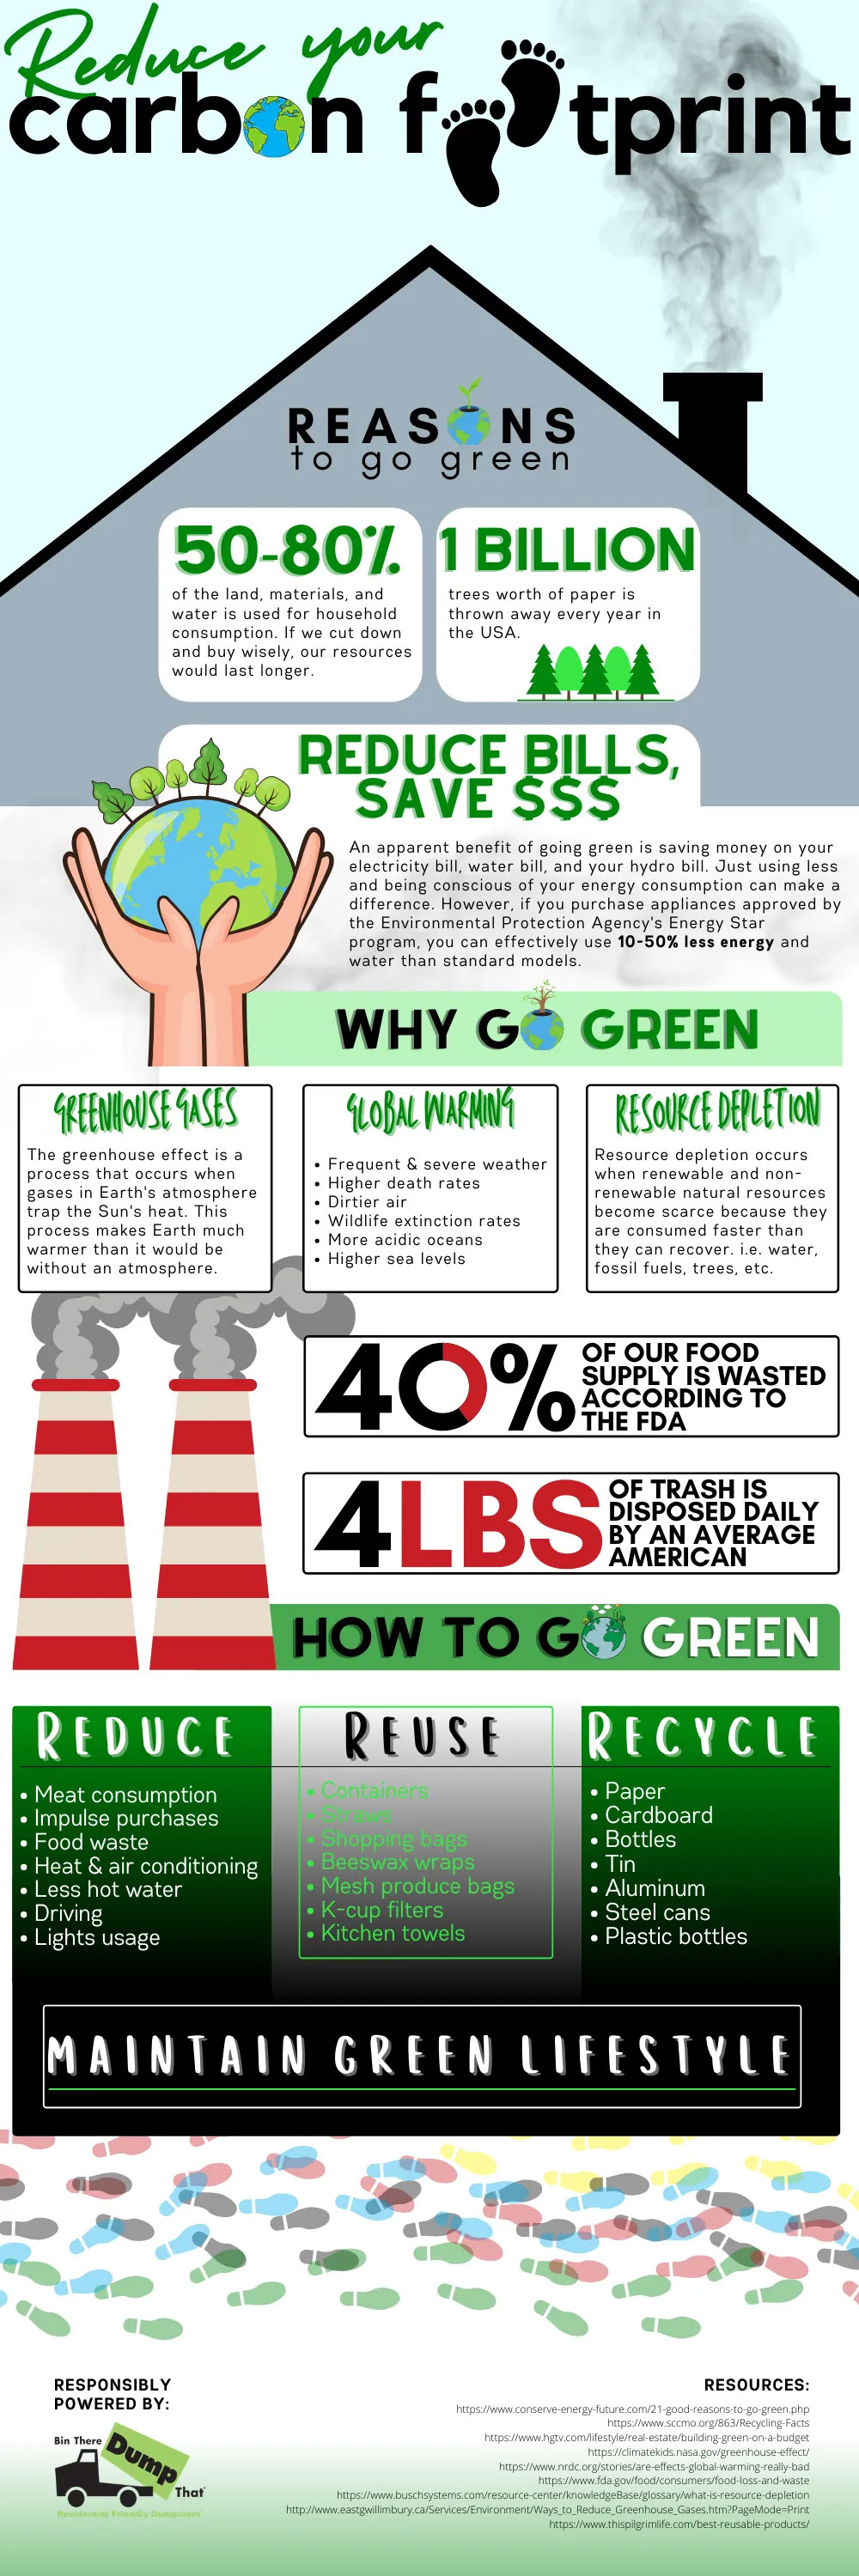
Image Source: infographicsarchive.com
Carbon footprint refers to the amount of greenhouse gasses released into the air due to our activities. Some simple changes in daily living and typical business practices can reduce our carbon footprint significantly.
94. Eco-friendly merchandise ideas for businesses

Image Source: pens.com
Make a lasting impact on consumers of your brand’s eco-friendly practices. Explore these merchandise ideas of reusable drinkware, straws, keychains, bags, and more.
95. Become an e-waste recycling champion
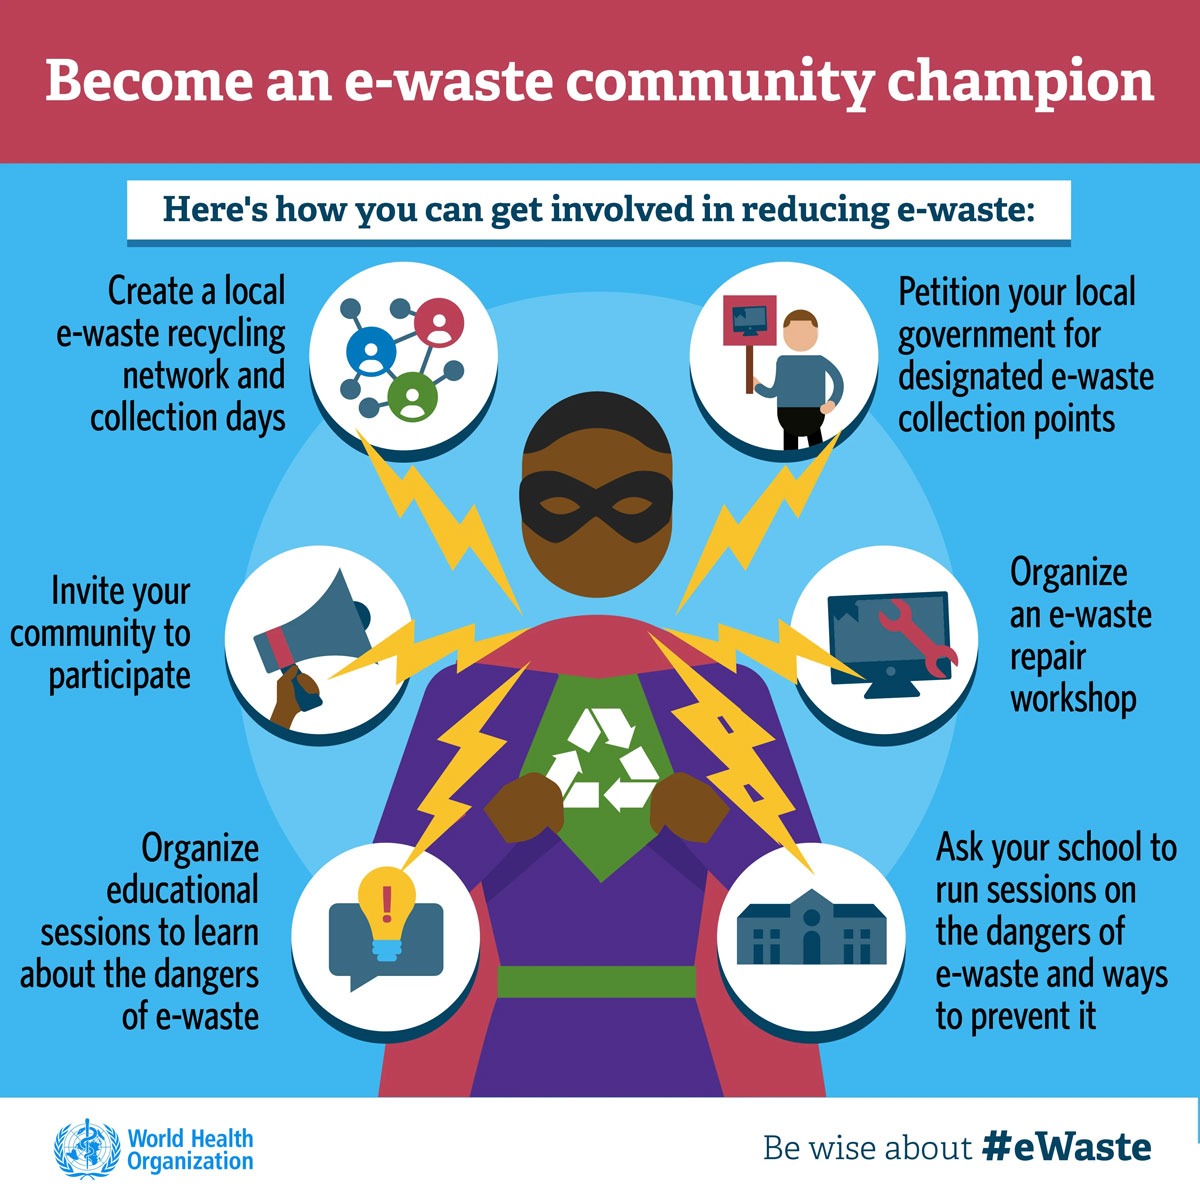
Image Source: who.int
Start community initiatives to make recycling a neighborhood activity. Here are some ideas by the World Health Organization.
96. Alternatives to throwing away
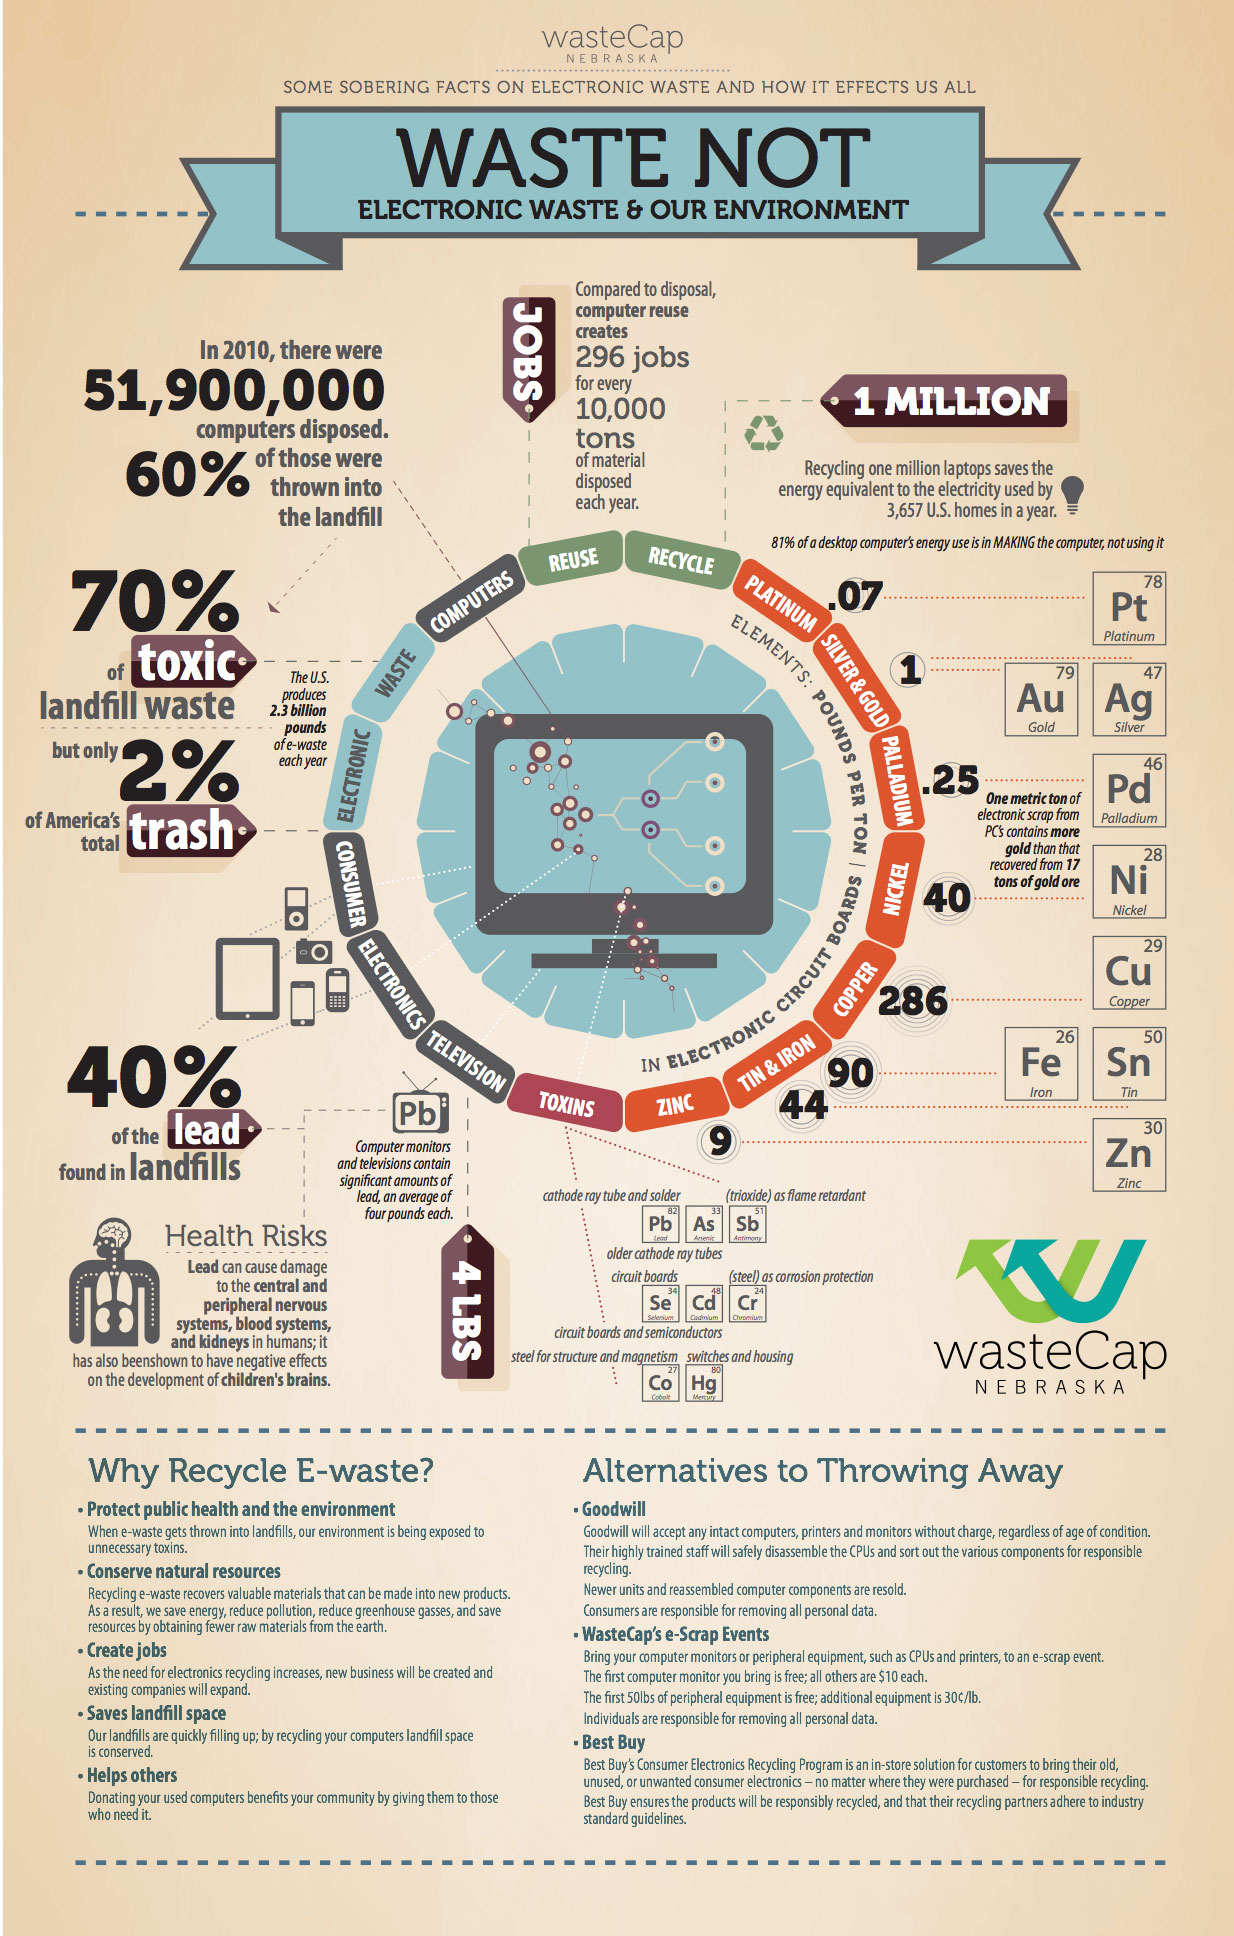
Image Source: wastecapne.org
When you don’t want to throw e-waste away yet struggle with recycling for any reason, the infographic below gives you some cool ideas at the end of organizations you can give it to.
97. Recycling electrical goods in the UK

Image Source: resource.co
Did you know that the average person in the UK buys 3 new electric or electronic products every year? Find more astonishing facts about the UK’s e-waste issue below.
98. Recycling myths
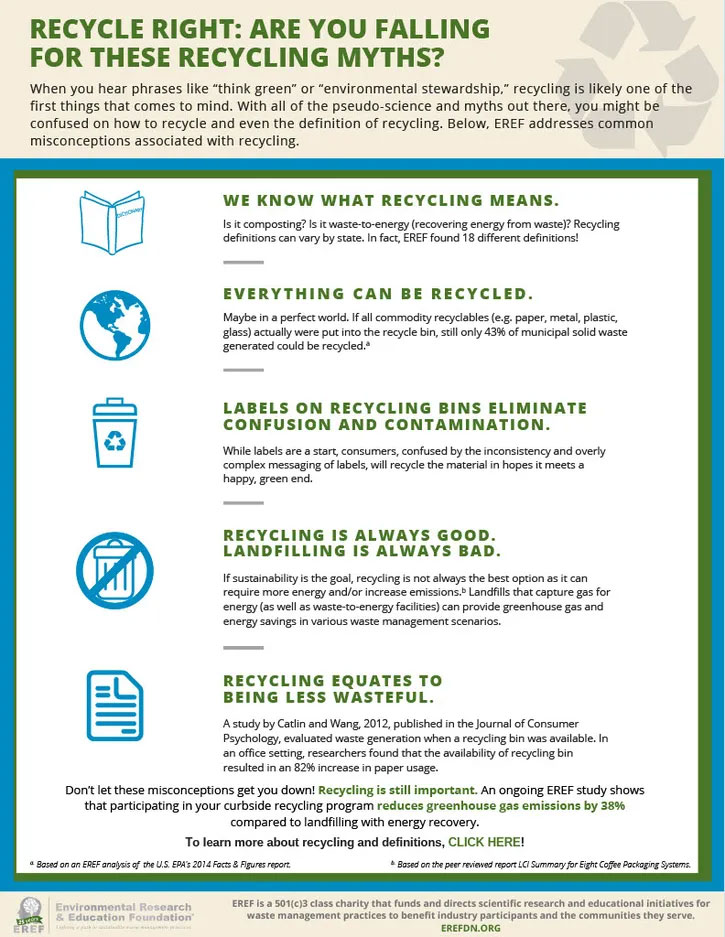
Image Source: waste360.com
Do you believe that no trash must be sent to landfills? If you do, that’s a myth so many of us initially fall for. The reality is that recycling can be expensive and landfills, when done properly, help us save energy by turning waste into power.
Check out more recycling myths in this chart.
99. Waste management according to the UN
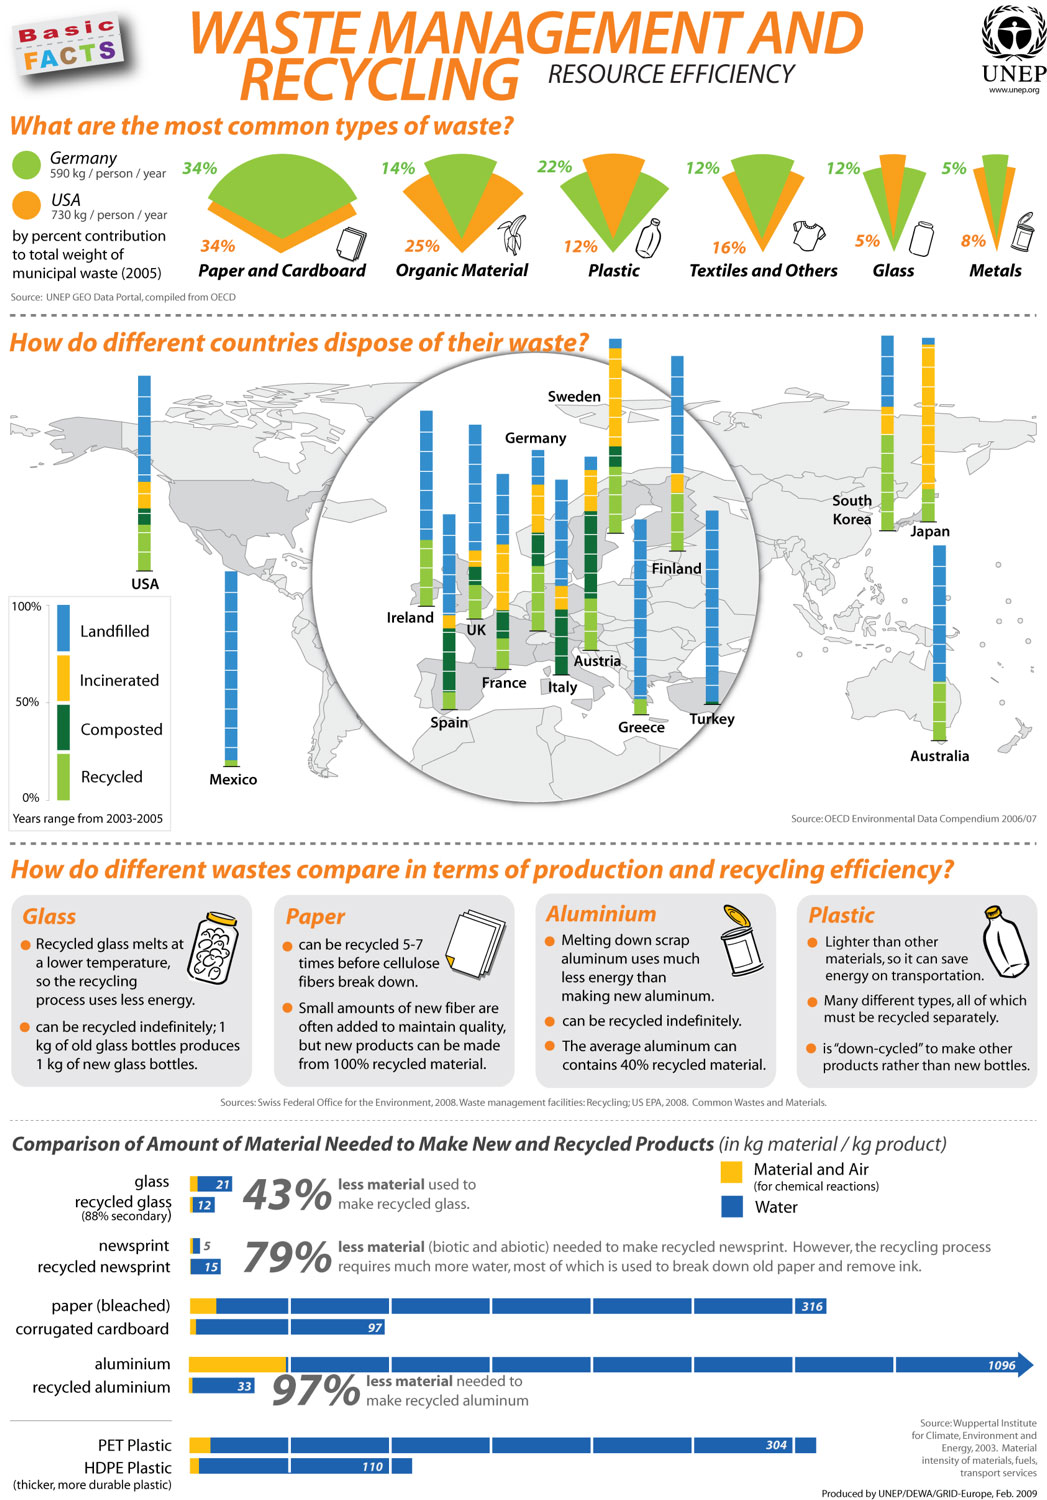
Image Source: harmony1.com
What does the United Nations have to say about the insane amounts of waste the world produces every year? Find out below.
100. Sustainability at CSU
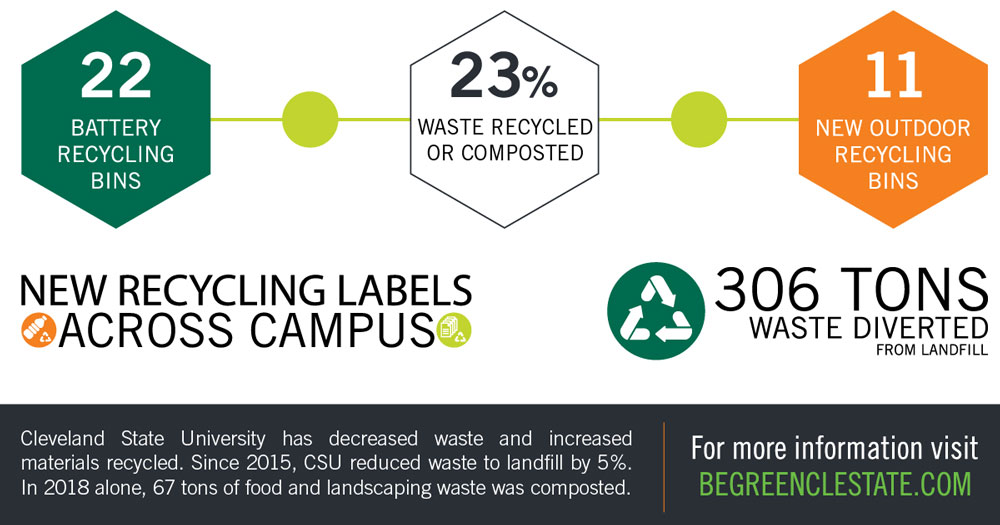
Image Source: csuohio.edu
Cleveland State University shares the steps it has taken to reduce its waste and the impact it has made through its recycling efforts.
101. What is ITAD
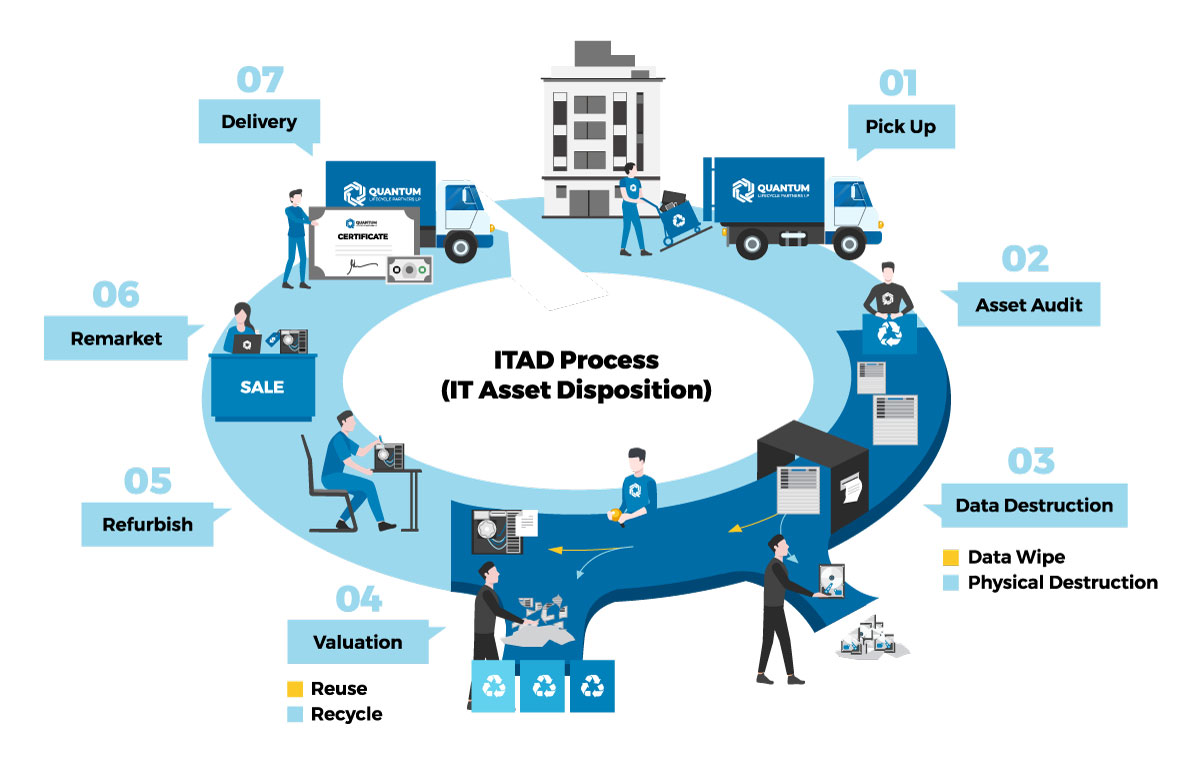
Image Source: quantumlifecycle.com
ITAD is IT asset disposition where enterprise-level recycling takes place. Businesses with lots of IT infrastructure need expert ITAD professionals to come in, secure their IT assets, dispose of the data neatly, and help them achieve their sustainability goals.
102. Global ITAD market
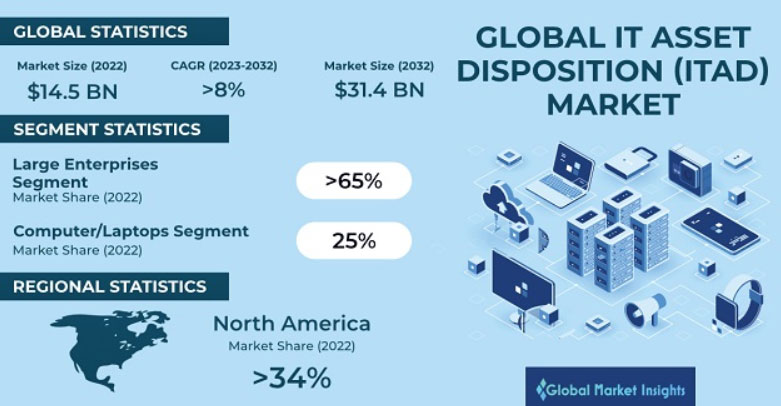
Image Source: gminsights.com
The global ITAD market, spurred by sustainability goals at the consumer and corporate level, is growing exponentially. According to this data, the market is expected to grow to $31.4B by 2032.
Conclusion
Every year, the world generates shocking amounts of e-waste, and only a fraction of it is recycled. Though most governments in the developed world have outlawed improper e-waste disposal, the widespread adoption of electronic recycling remains a distant dream.
To understand the global e-waste crisis with depth and context, we have created this extensive resource for customers and businesses to consider and explore.
We’ll keep adding to this space so bookmark the page and share far and wide.
About The Author Kelly Sampson
Kelly Sampson is a writer, blogger, and environmental enthusiast. She has strong opinions about climate change, the dogs vs. cats debate, and Oxford commas. She has lent Hummingbird International her engaging and spirited voice and turned our blog into a great place to find valuable information about e-waste, e-waste recycling, and the ITAD industry. Explore our blog to read more of her work.


